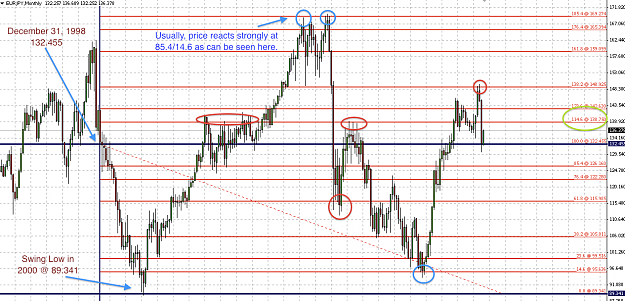
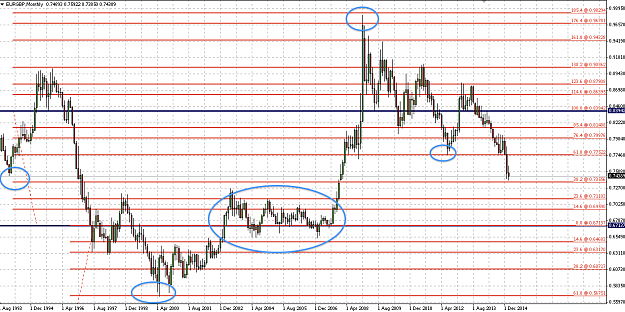
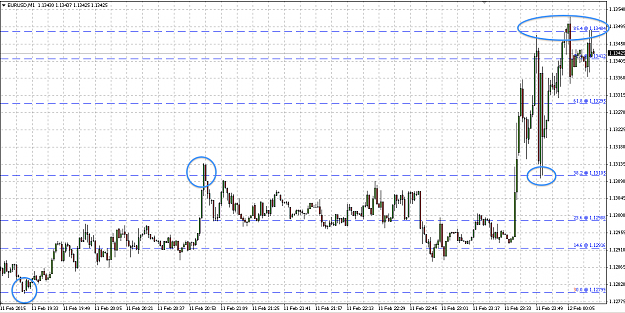
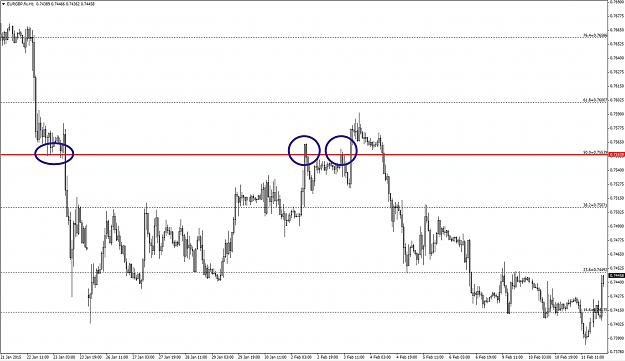
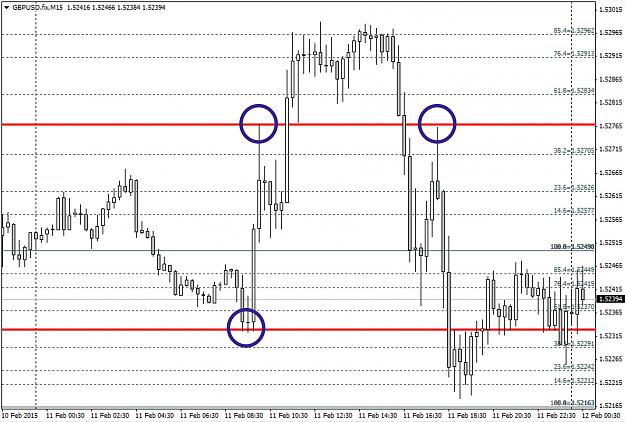
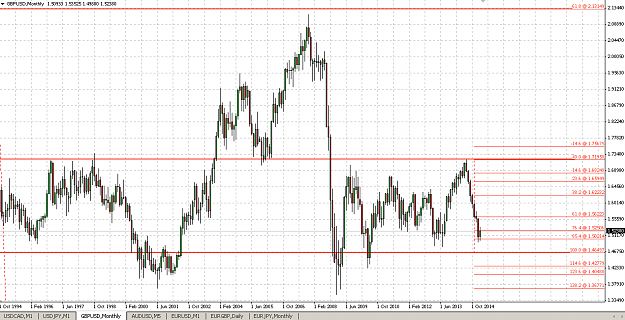
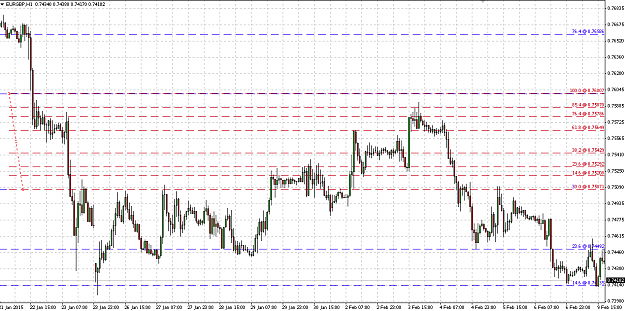
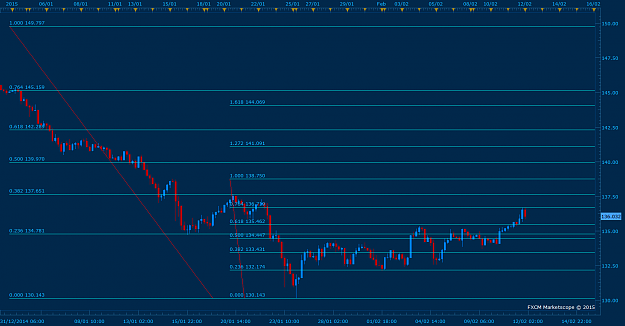
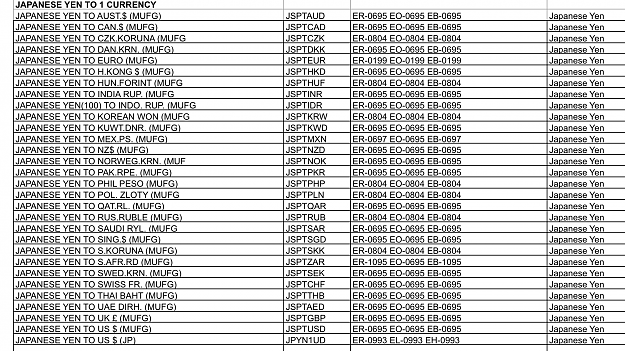
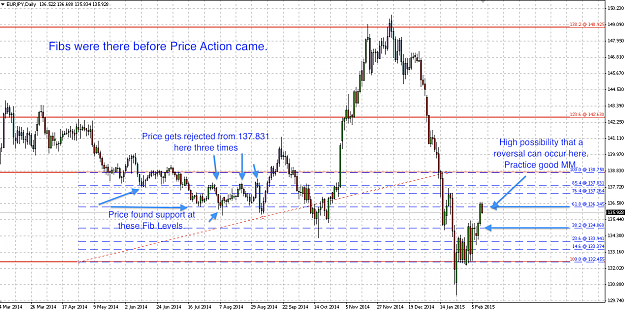
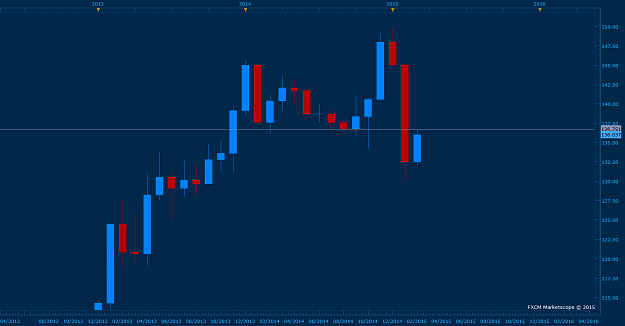
DislikedNow that we have the monthly charts I will provide examples of how to continue drawing fibonacci levels within these levels to see how the price behaves and will use EURGBP as an example. See how the price behaves around the fibonacci levels? You can go as far as 1minute to see how it behaves if you want more proof of how professional traders trade. {image} {image} {image}Ignored
Can I see the whole chart from the beginning cause I get different levels? Can you just show the first original fib level on EURGBP from where you draw inner fibs?