by looking at the magnitute of the move, when you see shorter move, that's retracement. Another element is the time, it takes longer time and choppy movement when you see retracement. at the top of the retracement, that's when you go in.
another way to do this is using MACD as directional indicator, and stochastic as entry.
Hello Yao, by looking at the magnitute of the move, when you see shorter move, that's retracement. Another element is the time, it takes longer time and choppy movement when you see retracement. at the top of the retracement, that's when you go in. another way to do this is using MACD as directional indicator, and stochastic as entry. hope it helps. LP
Hey guys, I think ive finally seen the light with this method over this weekend whilst studying over the thread again, all i can say is that the overbought areas are not the main focus like everyone is making out, its all about when the higher timeframe oscillator leaves the overbought/sold area and the timeframe oscillator below that one goes against it briefly like a pull-back and back in direction with the higher TF, this is when you should get into the trade. {image}
Ignored
Read post #303 by 101investing...he advises us to follow main trend, and see how 'price' response to the oscillator!
Hello Yao, by looking at the magnitute of the move, when you see shorter move, that's retracement. Another element is the time, it takes longer time and choppy movement when you see retracement. at the top of the retracement, that's when you go in. another way to do this is using MACD as directional indicator, and stochastic as entry. hope it helps. LP
Ignored
I agree with Yao and others, a chart will speak clearer....please post chart.....
{quote} I agree with Yao and others, a chart will speak clearer....please post chart.....
Ignored
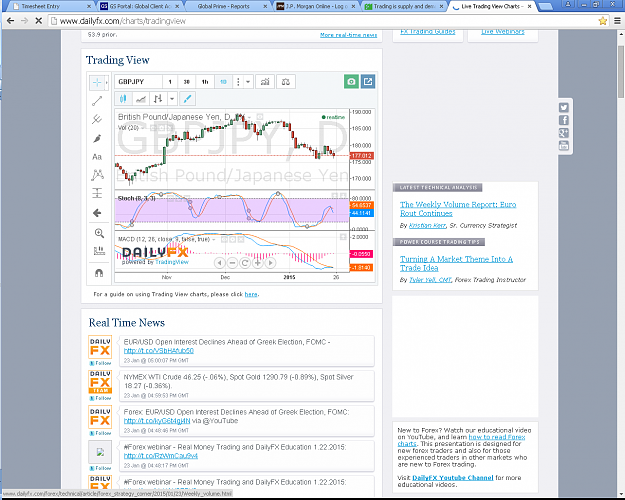
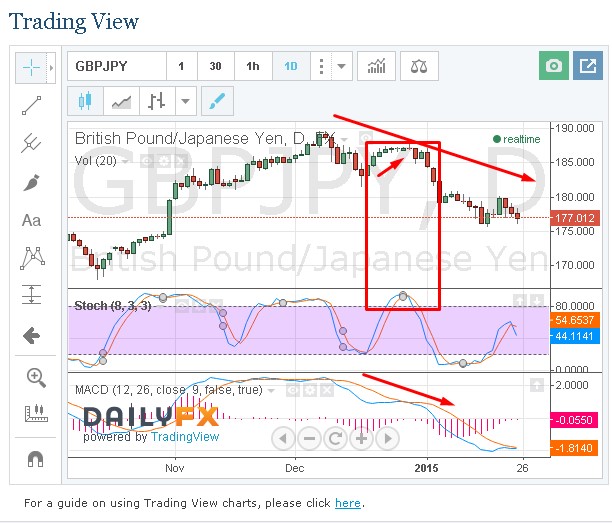
Please see chart. I dont mean to intrude 101's thread, I hope it helps other traders. MACD is directional indicator, so it shows the big trend. in the mean time, stoch is cyclical indicator, it shows cycles within the trend. By looking at the magnitude of the cycle we can indentify trend direction. Same Idea with the stoch. I post the pic just hope to help you understand. i'm at work, so i just post the online chart. sorry...
{quote} Please see chart. I dont mean to intrude 101's thread, I hope it helps other traders. MACD is directional indicator, so it shows the big trend. in the mean time, stoch is cyclical indicator, it shows cycles within the trend. By looking at the magnitude of the cycle we can indentify trend direction. Same Idea with the stoch. I post the pic just hope to help you understand. i'm at work, so i just post the online chart. sorry... LP {image}
Ignored
Thanks LP
Attached Image
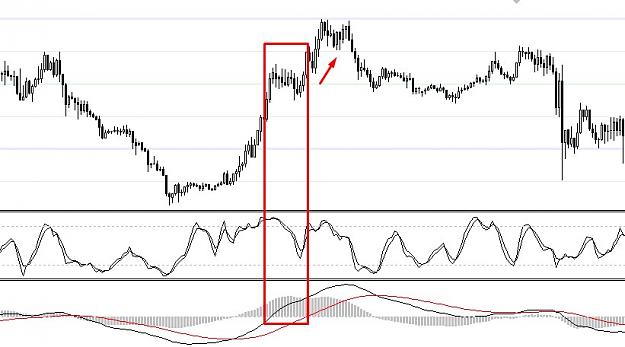
So from my understanding The price is reacting normally to the MACD and then there is a pullback upwards and price looks like it slows down, this is the time that the stochastic also goes into overbought and this would be our trade is this correct? thx
{quote} Thanks LP {image} So from my understanding The price is reacting normally to the MACD and then there is a pullback upwards and price looks like it slows down, this is the time that the stochastic also goes into overbought and this would be our trade is this correct? thx
Ignored
BIngo, but becareful on one thing, the pic i showed is after the fact, in real time, its really hard to see, because the MACD could be sticking together (the lines), so its hard to tell if it will cross up and trend change to upside. But with the help of "going with the main trend", in this case, its down, you can pretty much nail it. plus if there is any major news come out during that time, it would act like catalyst and price dropped even faster.
{quote} BIngo, but becareful on one thing, the pic i showed is after the fact, in real time, its really hard to see, because the MACD could be sticking together (the lines), so its hard to tell if it will cross up and trend change to upside. But with the help of "going with the main trend", in this case, its down, you can pretty much nail it. plus if there is any major news come out during that time, it would act like catalyst and price dropped even faster. hope it helps. LP
Ignored
I understand now, i believe that with practice it becomes easy
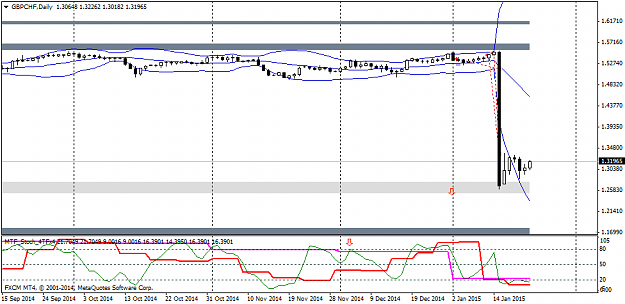
Thank you for sharing your method Investing101 - using the oscillator to gauge supply and demand is brilliant.
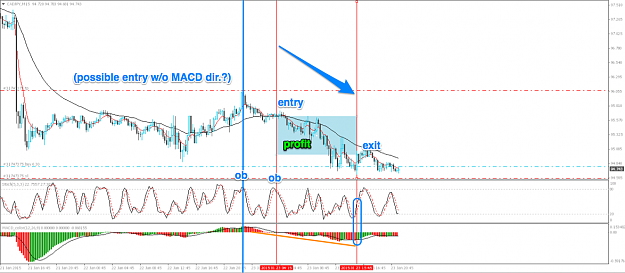
Attached is an example of my interpretation. Following this method would have prevented you from being long on gbpchf when the **** hit the fan last week.
The top gray bar is supply. The stochastic: purple-MN, red-W1, green-D1.
The 1st arrow in the sub-window is when the MN started turning down from OB - back in December. Recall that Investing 101 stated not to go against the monthly osc. unless it was OB/OS and prices were consolidating.
The 2nd arrow shows D1 & W1 stoch in OB, after a relatively weak move into supply. Went short after the outside bar, then added 2 more positions as the D1 osc. moved up strongly while price, not so much. 1st target was 200 pips, 2nd & 3rd were swept down with the tsunami.
Hello Yao, by looking at the magnitute of the move, when you see shorter move, that's retracement. Another element is the time, it takes longer time and choppy movement when you see retracement. at the top of the retracement, that's when you go in. another way to do this is using MACD as directional indicator, and stochastic as entry. hope it helps. LP
Ignored
Thank you, low profile;
I can see there is a tight relationship between MACD and stochs, will study more. True, its a very great tool to see the move, many many thanks to ur contribution.
{quote} Thank you, low profile; I can see there is a tight relationship between MACD and stochs, will study more. True, its a very great tool to see the move, many many thanks to ur contribution. regards, Yao