If you are a regular reader of my thread, you know I like to use my imagination to perfect my trading skills.
I had an idea about something new this week that could help you improve your trading and maybe control emotional trading issues. This idea is probably only possible for people who trade with indicators. If you trade against support/resistance lines, such as Fibonacci, trend, pivot, etc...then this might not work.
However, for those who use indicators to depict momentum and find tops and bottoms, then this could work.
Additionally, this technique is also probably best used by traders who trade intraday. If you are a position trader, then this idea is probably not that good. But, if you trade small time frame charts, you might like this.
Okay, small time frame traders who use indicators might consider this. I think we have a natural tendency to look at the candles as they are being formed. We also have a tendency to look at our profit/loss as it moves through time. I think this causes anxiety. Have you ever caught yourself talking to the chart or the market? LOL. I know I have Then I look at the indicators and tell myself everything is fine. So, this week it suddenly came into my head why not black out the candles?
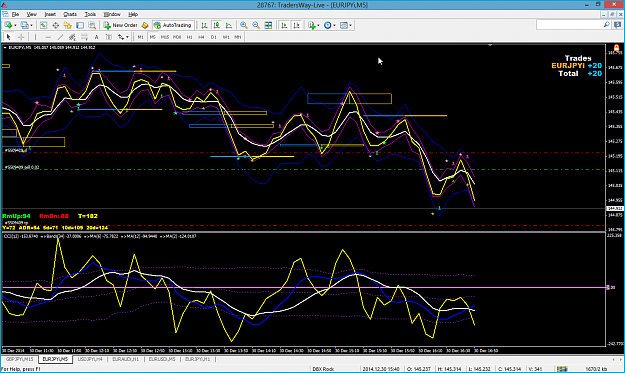
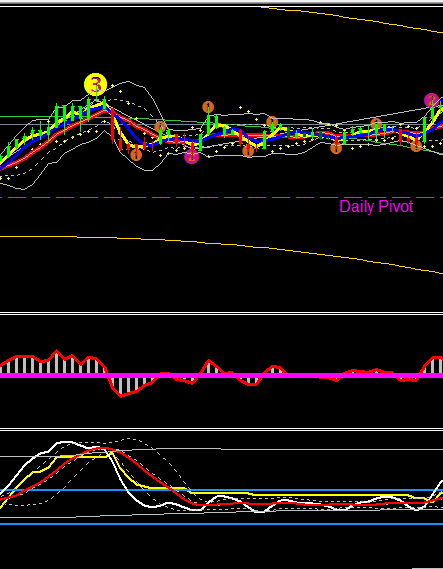
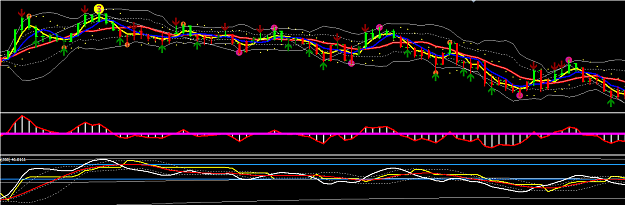
As you know I used black charts to lower the glare of my computer screen at night. Even though I trade from home now, I still use the black background. It is just habit now So, I changed the properties to see how everything would look. I made the candles all black and even the bid line is black. So I have no idea what the candle looks like, or where the current market price is.
Have you ever trained to fly airplanes? There is a similar technique called IFR, Instrument Flight Rules. This is how you fly when you have no visual earth features. For example, you cannot see the ground at night, nor in fog, so you must rely on your indicators to know your altitude, direction, and speed.
Try it on your chart I suspect trading will be boring until after New Year's. So now is a good time for experimenting. That is depending on your family life and schedule. But, if you find yourself bored, try making two charts. One is your normal system, and the other is with blacked out candles. HA, even I am going to do this at some point in the next few days. I am going back to September just before the market volatility came back.
If you listened to my advice about lowering your history, then you need to go to Tools/Options and add some candles. I changed to 20,000. That puts me in at about Sept 19. Next, I bought the float software so I can easily go full screen for both charts. If you cannot, then at least do a split screen by using Windows/Tile Vertically.
Then simply compare the charts. Find your entries and exits with your full blown system, and then see if your blacked out chart looks reasonable to trade.
Why do this? I realize that trading is 20% mechanical and 80% mental. If you cannot control the mental, you will struggle to profit. If you are supposed to be using your indicators to make trading decisions, but you find yourself relying on candles or find yourself anxious, or find yourself panicking, or find yourself questioning yourself...could it be you are getting too many inputs into your head?
Consider this too:
1. What is the primary tool the market makers have to make you lose? HEAD FAKES!!!!
2. What do losing traders do? Enter or exit the market at the wrong time because it looks like momentum is changing by the creation of the next candle.
3. What is your primary anxiety? Not knowing where the real top/bottom is.
Isn't that what your indicators tell you? Have you ever exited because it "felt" right? You had no reason to exit other than a feeling. Then 10 seconds later, or less, off the market went without you. Why did you do it? Probably because of market maker trick #2. This trick is where they probe a support/resistance line and cause confusion. Price is bouncing, or pretending to break and falling back, or falling back and bouncing again. HAHAHAHAHAHA. Meanwhile your indicators are saying...this makes no sense...just hold the position. BUT, your brain has too many inputs from those candles. AND YOU, well, you have not conditioned yourself to ignore all that activity and trust your indicators. So, you quit, and the market does what you predicted it would do. Only it is doing it without you.
Use the weekend to look at your charts side-by-side. You might even see some areas that need tweaked. Since trading will likely be boring, then demo next week with the blacked out chart. See how you feel. See if there is any difference in your abilities. **Remember to change your chart history back to 2100.
If anything, it won't be boring I am going to do it myself Sounds like fun And how bad-azz are you going to be if you don't even use candles? LOL. There is only so much I can help people with since the tools are only 20% of the solution. Perhaps this idea will help with the other 80%?
Talk to you next weekend and discuss the results.
I had an idea about something new this week that could help you improve your trading and maybe control emotional trading issues. This idea is probably only possible for people who trade with indicators. If you trade against support/resistance lines, such as Fibonacci, trend, pivot, etc...then this might not work.
However, for those who use indicators to depict momentum and find tops and bottoms, then this could work.
Additionally, this technique is also probably best used by traders who trade intraday. If you are a position trader, then this idea is probably not that good. But, if you trade small time frame charts, you might like this.
Okay, small time frame traders who use indicators might consider this. I think we have a natural tendency to look at the candles as they are being formed. We also have a tendency to look at our profit/loss as it moves through time. I think this causes anxiety. Have you ever caught yourself talking to the chart or the market? LOL. I know I have
As you know I used black charts to lower the glare of my computer screen at night. Even though I trade from home now, I still use the black background. It is just habit now
Have you ever trained to fly airplanes? There is a similar technique called IFR, Instrument Flight Rules. This is how you fly when you have no visual earth features. For example, you cannot see the ground at night, nor in fog, so you must rely on your indicators to know your altitude, direction, and speed.
Try it on your chart
If you listened to my advice about lowering your history, then you need to go to Tools/Options and add some candles. I changed to 20,000. That puts me in at about Sept 19. Next, I bought the float software so I can easily go full screen for both charts. If you cannot, then at least do a split screen by using Windows/Tile Vertically.
Then simply compare the charts. Find your entries and exits with your full blown system, and then see if your blacked out chart looks reasonable to trade.
Why do this? I realize that trading is 20% mechanical and 80% mental. If you cannot control the mental, you will struggle to profit. If you are supposed to be using your indicators to make trading decisions, but you find yourself relying on candles or find yourself anxious, or find yourself panicking, or find yourself questioning yourself...could it be you are getting too many inputs into your head?
Consider this too:
1. What is the primary tool the market makers have to make you lose? HEAD FAKES!!!!
2. What do losing traders do? Enter or exit the market at the wrong time because it looks like momentum is changing by the creation of the next candle.
3. What is your primary anxiety? Not knowing where the real top/bottom is.
Isn't that what your indicators tell you? Have you ever exited because it "felt" right? You had no reason to exit other than a feeling. Then 10 seconds later, or less, off the market went without you. Why did you do it? Probably because of market maker trick #2. This trick is where they probe a support/resistance line and cause confusion. Price is bouncing, or pretending to break and falling back, or falling back and bouncing again. HAHAHAHAHAHA. Meanwhile your indicators are saying...this makes no sense...just hold the position. BUT, your brain has too many inputs from those candles. AND YOU, well, you have not conditioned yourself to ignore all that activity and trust your indicators. So, you quit, and the market does what you predicted it would do. Only it is doing it without you.
Use the weekend to look at your charts side-by-side. You might even see some areas that need tweaked. Since trading will likely be boring, then demo next week with the blacked out chart. See how you feel. See if there is any difference in your abilities. **Remember to change your chart history back to 2100.
If anything, it won't be boring
Talk to you next weekend and discuss the results.
You cannot be extraordinary by being normal