{quote} Obviously, buddy, But they can give us clues to be prepared for action. D.P.
Ignored
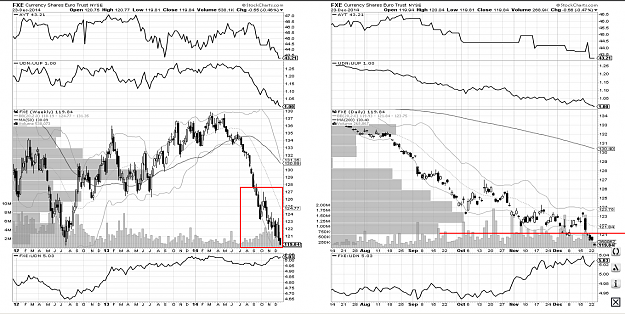
Using WRB, there is a daily frame in GU from 54.84 to 53.90. I have been the evening scalping longs below 55.00, because I though It was going to be a support, as it has been. Obviously, in a mainly downtrend, the daily frames are fullfilled, but is interesting to bear in mind where we are. We are in on the places were the last uptrend started. The another, and last daily frame is at 1.50.
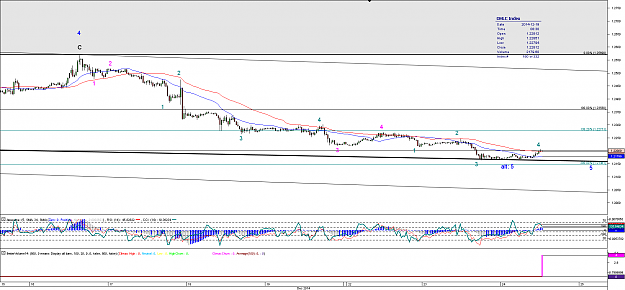
I think Euro is doom and unless USD under massive attack we are heading to accelerated down-bar on Monthly chart,
maybe after re-test of .2290 or .2350 ?
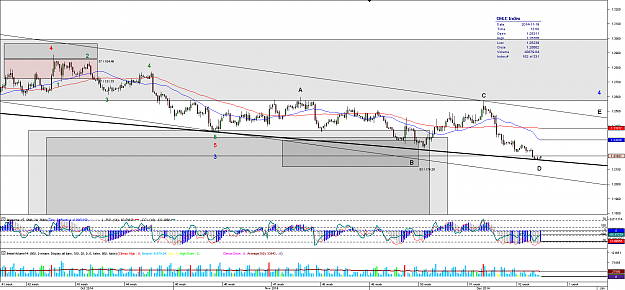
The structure of the drop from the 2569high is clearly overlapping. I am simply not able to count it as impulse. If someone has an idea on how to count this as impulse please show your count. Thanks in advance. On higher TF like 8h or above, the structure may be counted as impulse, but when using e.g. 1h TF we do have some strange overlaps.
The structure of the drop from the 2569high is clearly overlapping. I am simply not able to count it as impulse. If someone has an idea on how to count this as impulse please show your count. Thanks in advance. On higher TF like 8h or above, the structure may be counted as impulse, but when using e.g. 1h TF we do have some strange overlaps. Maybe this is the count: triangle wave blue 4 {image}
Ignored
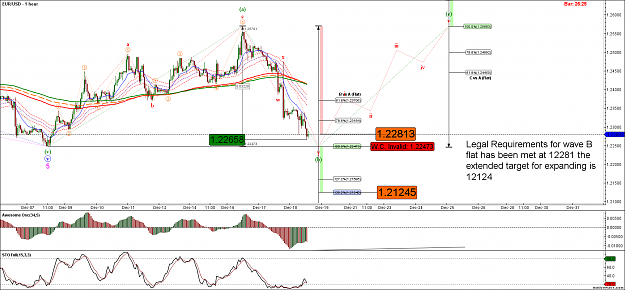
I am not an expert in Elliot,, but I have found this,maybe suits with your account. But from 21,20 to 21,60 appears as places to buy too.
On other hand, I feel that during American session, the volatility increase a lot. And the pressure to push the USDx is very hard ( as the S&P I supposse). So maybe, we would better wait where can this deeps going to during US sessions, till end of the year.
{quote} I am not an expert in Elliot,, but I have found this,maybe suits with your account. But from 21,20 to 21,60 appears as places to buy too. On other hand, I feel that during American session, the volatility increase a lot. And the pressure to push the USDx is very hard ( as the S&P I supposse). So maybe, we would better wait where can this deeps going to during US sessions, till end of the year. {image}
Infinitus good thing to always look in historical examples either fundies or techs or cot to get idea of direction, but i think this time it might be expection. I know the saying "what comes up must come down "-or oposite direction, but if you line down all facts in current situation it might be possible this is gona be one hell of long usd run that is gona keep lasting. That based on next years ECB policies, BOJ policies, RBA policies, SNB policies, FED policies (if and even if it doesnt, the rest CBs will take care of direction)... all those are for next year USD positive policies planned so its really hard to see any kind of USD reversal. Now that aside backed by technicals which point on EURUSD, GBPUSD, USDCHF, AUDUSD all USD positive view for next several months, at least what charts tell me.Dollar train just might get more crowded
This is my approach to next years USD trading. If honey badger sees USD longs, he is gona take it. He is gona short the crap out of EU. He dont give a shit.