Guys, dont worry about stops getting hit.If you trade with low risk, your head will be safe. If you dont use the stops then entering spiral of doom is inevitable, sooner or later.
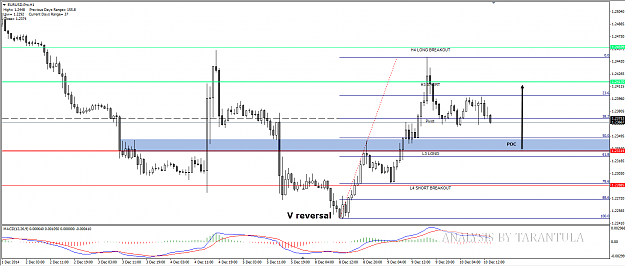
EUR does not have any major news today so its still risk on mode. We could see some retracement to 2350-30 and that is the place where buyers are. Fibs, previous breakout and L3 level is making for a POC. The POC is also coming from V shape reversal and we assume that EURUSD is in intraday bullish mode. Because there are no so important data today EURUSD might have a bullish L3 H3 range play.
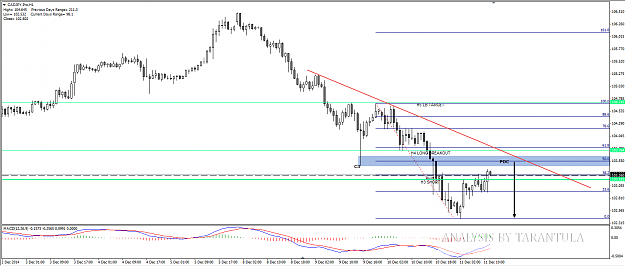
CADJPY is in nice downtrend. At 103.50-55 zone we can see a confluence of previous buyers at breakout point (C3) and presumably fresh sellers along with 50.0 fib. Intra week trendline is also capping its zig zag and its very close to h4 also. Targets for the rejection are 103.00 and 102.50
CADJPY is in nice downtrend. At 103.50-55 zone we can see a confluence of previous buyers at breakout point (C3) and presumably fresh sellers along with 50.0 fib. Intra week trendline is also capping its zig zag and its very close to h4 also. Targets for the rejection are 103.00 and 102.50 {image}
EUR does not have any major news today so its still risk on mode. We could see some retracement to 2350-30 and that is the place where buyers are. Fibs, previous breakout and L3 level is making for a POC. The POC is also coming from V shape reversal and we assume that EURUSD is in intraday bullish mode. Because there are no so important data today EURUSD might have a bullish L3 H3 range play. {image}
Guys, dont worry about stops getting hit.If you trade with low risk, your head will be safe. If you dont use the stops then entering spiral of doom is inevitable, sooner or later.
Ignored
too late olmost burn out real practice acount : (
the hedging is was good for me but greed makes go wrong way .
discipline discipline a need to give a step back restart .
can you tell how you use macd on your entries ?
i have a sell eur usd last month trent line is reched now macd crossing
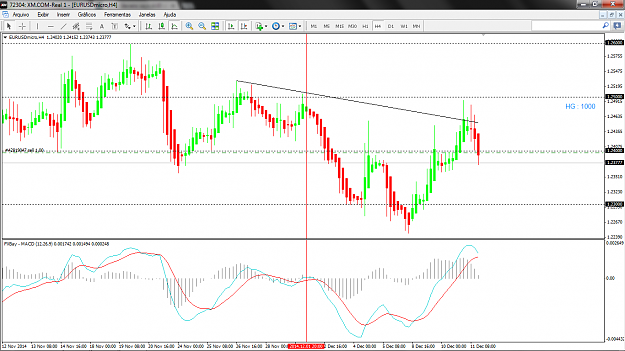
{quote} too late olmost burn out real practice acount : ( the hedging is was good for me but greed makes go wrong way . discipline discipline a need to give a step back restart . can you tell how you use macd on your entries ? i have a sell eur usd last month trent line is reched now macd crossing {image}
Ignored
Dont be greedy I dont use MACD for entries. MACD is telling me when there is a loss of momentum ( retracement ) and divergence. Counter trend setups and trades which I make are based on MACD divergence.
{quote} Dont be greedy I dont use MACD for entries. MACD is telling me when there is a loss of momentum ( retracement ) and divergence. Counter trend setups and trades which I make are based on MACD divergence.
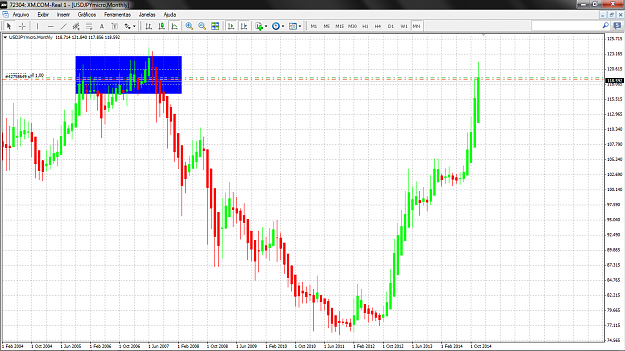
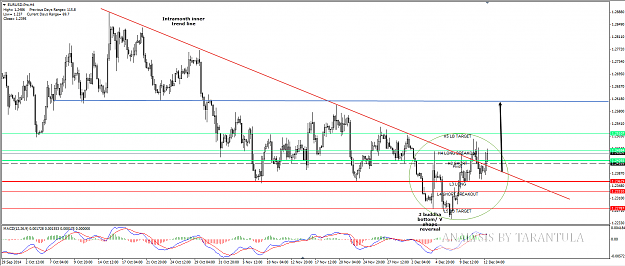
From intra week perspective EURUSD is targeting 2620 region. We see the inner trend line/3 buddha bottom/V shape reversal. Monthly Inner trendline intersects POC point. For 2620 to be reached 2280 must hold. The main event will be FOMC on Wednesday 17th Dec.
From intra week perspective EURUSD is targeting 2620 region. We see the inner trend line/3 buddha bottom/V shape reversal. Monthly Inner trendline intersects POC point. For 2620 to be reached 2280 must hold. The main event will be FOMC on Wednesday 17th Dec. {image}
Ignored
we have a triangulo there 1,236 base whit a fake break out to down side 1,268 isn´t it can you explain loss of monmentun and the divergence on macd some drowing in your forum are distint that what y normaly see before .