USDJPY is trapped in a strong ascending channel and even fundamentals are aligned with techs. Thats why we should not expect any big retracement prior to NFP results. From technical standpoint USDJPY has 3 important POCs. The first POC is the 114.20 to 114.30 zone and it marks L3, DPP and 50.0 fib of the last swing. Also POC1 is very close to the channel bottom, making up for additional confluence. POC2 should only be touched if channel gets broken to the downside where we see deeper retracement level 88.6 % fib and previous buyers. POC2 comes around...
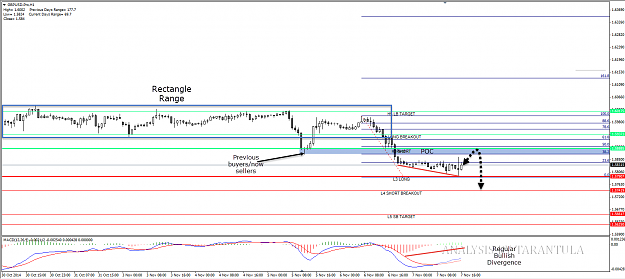
GBPUSD has finally broken out of rectangle range and it resumed downtrend. After NFP spike showed that GBPUSD could retrace to 5870-85 region where we could start searching for fresh selling opportunities. We have a confluence of previous buyers - now sellers, H3 , DPP and 38.2/50.0 fib. Rectangle low above serves as resistance. GBPUSD is expected to reach 5790 and 5740 on fresh selling.
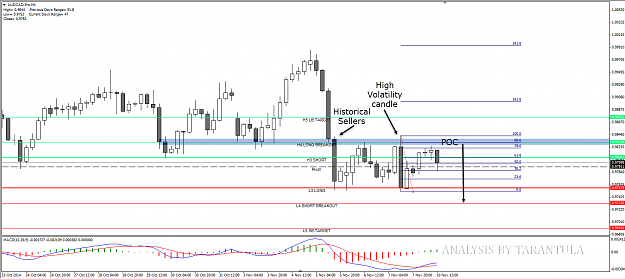
I have shown this couple of times with CAMMACD ™. Its called high volatility trading. AUDCAD is showing nice High Volatility candle setup and we could see that on first attempt to sell it around 78.6, the trade was pretty successful, as there are also historical sellers around the level.2nd chance sell trade might come around 9835 at 88.6 fib retracement towards 9760 and 9735. Stop is pretty much close ( around 9855 ). High volatility candle is also trapped in the range, so for 9735 and lower 9760 needs to break first.
I have shown this couple of times with CAMMACD . Its called high volatility trading. AUDCAD is showing nice High Volatility candle setup and we could see that on first attempt to sell it around 78.6, the trade was pretty successful, as there are also historical sellers around the level.2nd chance sell trade might come around 9835 at 88.6 fib retracement towards 9760 and 9735. Stop is pretty much close ( around 9855 ). High volatility candle is also trapped in the range, so for 9735 and lower 9760 needs to break first. {image}
Ignored
That's a wonderful trade... This is something new for me, High Volatility Candle Trading. Thanks chief..
I have shown this couple of times with CAMMACD . Its called high volatility trading. AUDCAD is showing nice High Volatility candle setup and we could see that on first attempt to sell it around 78.6, the trade was pretty successful, as there are also historical sellers around the level.2nd chance sell trade might come around 9835 at 88.6 fib retracement towards 9760 and 9735. Stop is pretty much close ( around 9855 ). High volatility candle is also trapped in the range, so for 9735 and lower 9760 needs to break first. {image}
GBPUSD has finally broken out of rectangle range and it resumed downtrend. After NFP spike showed that GBPUSD could retrace to 5870-85 region where we could start searching for fresh selling opportunities. We have a confluence of previous buyers - now sellers, H3 , DPP and 38.2/50.0 fib. Rectangle low above serves as resistance. GBPUSD is expected to reach 5790 and 5740 on fresh selling. {image}
Ignored
bro now what u say about gbp usd pattren is still valid or not?????