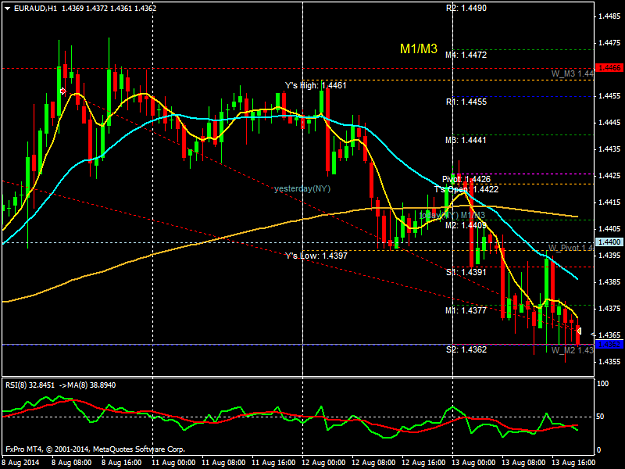
Sold euraud at 1.4457 and 4433. We are in area of M1 1.4377, 50% retrace of the move up Aug low/high and the 23 June low. No plans to exit as yet. Will post charts if trade plays out.
Ignored
Can we go lower from here, of course, but last week we missed out on the big move lower when our TP was just missed. So banking +66 and +90.
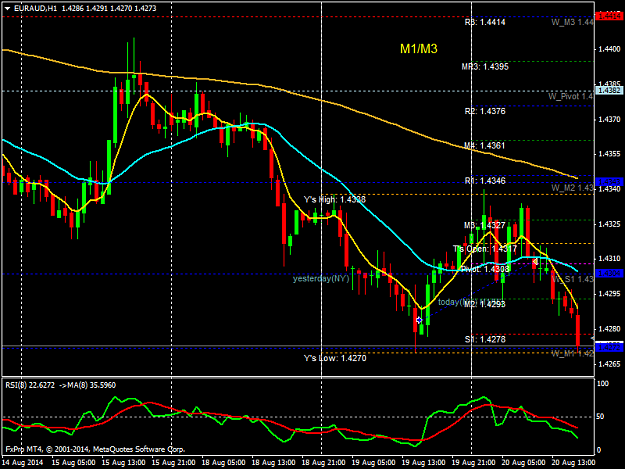
Euraud bounced up from W M1 1.4272/6 Aug low combo, bought 1.4284 yesterday. Moved lower in Asian session this morning reaction to last weeks low. Hopefully that's out of the way. Will post charts if trade plays out.
Euraud bounced up from W M1 1.4272/6 Aug low combo, bought 1.4284 yesterday. Moved lower in Asian session this morning reaction to last weeks low. Hopefully that's out of the way. Will post charts if trade plays out.
Ignored
Did not get the kind of follow through we'd have liked to see out +25.
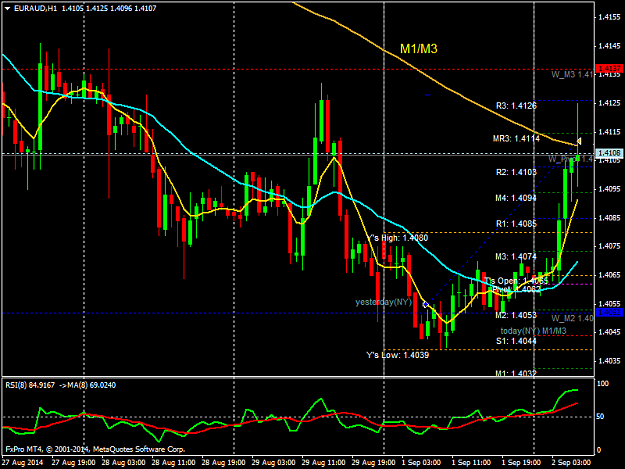
Thursdays massive fall had no follow through lower on Friday. Bought the bounce from the multiple bottom off W M2 with positive divergence on 1 and 4hr.
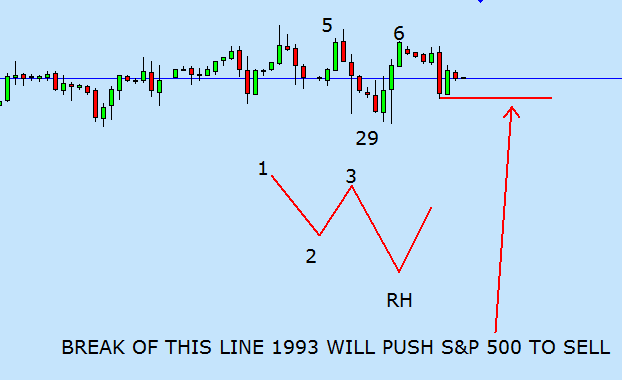
Don't follow it at all, no idea what TF that is. There is a channel low below your red line which would also come into play. Either you look at the level you suggest or a decent LH 'wave' below the lows i.e. a break and retest of the absolute low on the chart.
I am going to try and understand this trading method and i think the best way to do it is by posting charts of how i currently see the market and get feedback on my view of the market. So please tell me when you think otherwise.
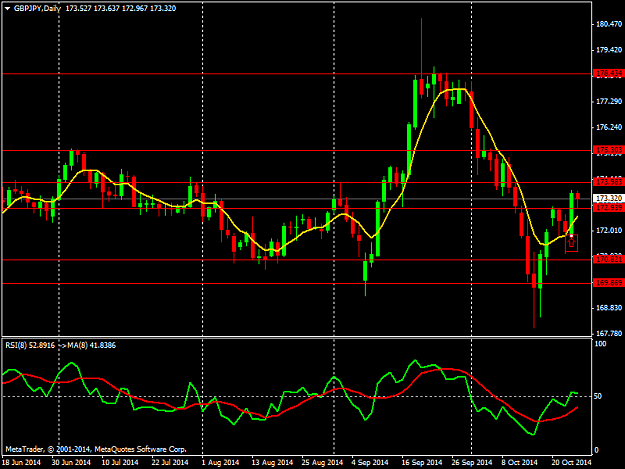
First chart is the D from GBPJPY.
As i see it according to the rules focus should be on buy, but to me it doesn't feel right for the number of reasons.
1. on 19 sept we touched the a weekly res
2. the uptrend already lasted a long time
3. price made a lower low witch makes me think that a downtrend could be coming.
Would it be better to wait and look for bearish price action around the circle i drew?
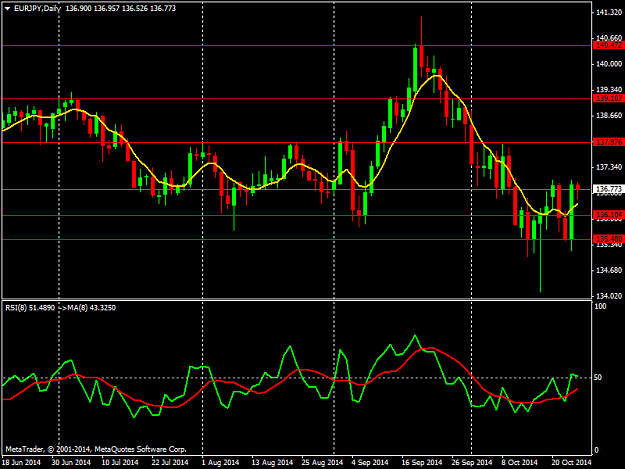
Next chart is D eurjpy
If the current daily candle would close the way it now is (in 3hours) would it be a valid buy focus for tomorrow.
The red line is D support, the rsi crossed the ma the candle would close above the 8lwma ,even if it would close just below it is still e very strong candle. Inside the circle we can see a higher high higher low flow forming. This are all things that promote it to be a buy focus.
On the other hand, if you look at the big picture then you can clearly see there is still a downtrend and the bullish engulfing candle can just be part of a retrace.
Hi, I am going to try and understand this trading method and i think the best way to do it is by posting charts of how i currently see the market and get feedback on my view of the market. So please tell me when you think otherwise. First chart is the D from GBPJPY. As i see it according to the rules focus should be on buy, but to me it doesn't feel right for the number of reasons. 1. on 19 sept we touched the a weekly res 2. the uptrend already lasted a long time 3. price made a lower low witch makes me think that a downtrend could be coming. Would...
Ignored
Will try and give my view in line with the concepts given in detail on the blog, see links in 1st post. Then looking at the two major general concepts of trend and support/resistance.
OK then, we have had a strong rejection of the move below the May and Oct lows around 170 that finished with the 3 bar reversal (morning star pattern on 16th Oct). RSI crossed up but we are below the 8 lwma. Sometimes ma's can throw you off a bit and whilst I am skeptical of any close that cannot cross a ma the reason it didn't in this case is the speed in the move down accelerated into 15 Oct pulling the candles away from the ma. That 3 bar reversal of a true proven D SR level is a great signal. Since then we have had a D higher low yesterday that cleared and we are at the May highs. My D trend definition has been met with both the 3 bar reversal at the lows and then the D HL.
Looking at the 1hr yesterday we had a solid 3 bar reversal that broke the immediate range, little/no upper wick, so the flow is back up. The flow this morning is HH, HL and for me no reason so far not to think we will continue.
On your comments the 19 May high is 100's of pips away, there are other resistance levels in between though. Yes the uptrend has lasted a long time but for now the move lower has been rejected. If we are moving lower its not showing yet. Trends can last for longer than expected. Depending on your entry and trading timetable I don't really see reasons yet not to look at buys with decisions to move stops quickly etc.
If you are uncomfortable though and don't see better set ups out there then leave.
Next chart is D eurjpy If the current daily candle would close the way it now is (in 3hours) would it be a valid buy focus for tomorrow. The red line is D support, the rsi crossed the ma the candle would close above the 8lwma ,even if it would close just below it is still e very strong candle. Inside the circle we can see a higher high higher low flow forming. This are all things that promote it to be a buy focus. On the other hand, if you look at the big picture then you can clearly see there is still a downtrend and the bullish engulfing candle...
So if you were a buyer yesterday after the hammer rejecting the move below the SR level 135.40 area then are the CT rules there?
The SR level goes back to Oct '13 and is clear, we have rejected at a W pivot, we have divergences, pa didn't go lower for hours and when it did rejected with a large lower wick. So the CT rules are pretty much in place.
Being CT though at that time you would need to decide if this is start of major move up or just a rally in down trend (we don't know yet) and trade accordingly with stop size, moving to BE and exiting.
{quote} If you see this as a downtrend then you must decide if the counter trend rules apply, http://www.vantagefx.blogspot.com/20...-consider.html So if you were a buyer yesterday after the hammer rejecting the move below the SR level 135.40 area then are the CT rules there? The SR level goes back to Oct '13 and is clear, we have rejected at a W pivot, we have divergences, pa didn't go lower for hours and when it did rejected with a large lower wick. So the CT rules are pretty much in place. Being CT though at...
Ignored
And if you were an ej buyer today you'd want an entry that would give you some scope to get to BE as the 20/21 Oct/Y's high is obviously a potential problem.
As a final point for now sitting duck I'd say whatever method, strategy you finally rest on consistency of view point and application of trade rules will probably be one of the most important stages to get to.
Many of the links on the first post to the blog are for posts done that are now years old and they were for methods/views that for the most part were around for a long time. Very, very little has changed when I assess the market. Yes the entry TF may have changes but the basics in assessment haven't.
Thanks for your insights.
I feel indeed uncomfortable going long in this case because i can find reasons that it can go down and reasons that it can go up witch leaves me with no direction
Thats why its important for me to see how you guys see this market. I always feel uncomfortable to buy when price already went a long way up, thinking the market will have to turn soon. Maybe that is just something i will have to overcome to get successful.
Hi mr V, Thanks for your insights. I feel indeed uncomfortable going long in this case because i can find reasons that it can go down and reasons that it can go up witch leaves me with no direction Thats why its important for me to see how you guys see this market. I always feel uncomfortable to buy when price already went a long way up, thinking the market will have to turn soon. Maybe that is just something i will have to overcome to get successful. grtzz, Nik
Ignored
In the big pic its a long way up. But if you were buying yesterday or today the idea then becomes the first trade is the best, the first HL (or double bottom) and then your entry TF becomes critical. GBPJPY gave a decent entry around 173.32 so if you had doubts you'd be at BE, perhaps have half off already to see if it pops higher or takes you out.
Then theres the option like I said and as you did, if you don't like it sit out, it is Fri morning after all.
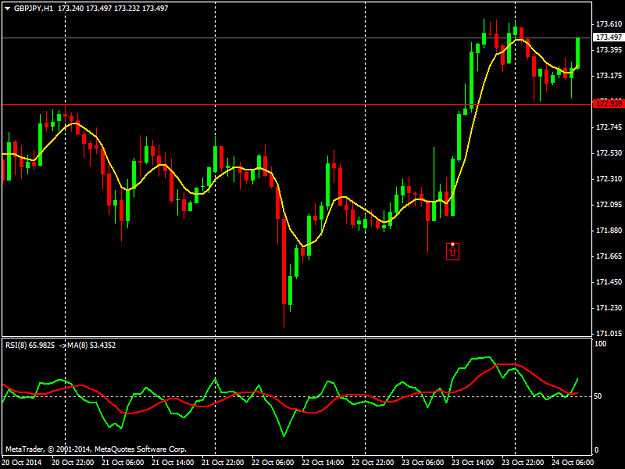
I just made a entry on gbpjpy. ( demo off course)
I saw a lower high on the 15min chart witch was also an engulfing candle. it would also have been a valid entry on the 1h chart around the same level.
Only the SL would have been different because the swing low on the 1h is lower then on the 15 min chart.
Maybe i should have moved my SL below the double bottom on the 15 minute chart so it would be much better protected and it would the same as on the 1h chart.
I just made a entry on gbpjpy. ( demo off course) I saw a lower high on the 15min chart witch was also an engulfing candle. it would also have been a valid entry on the 1h chart around the same level. Only the SL would have been different because the swing low on the 1h is lower then on the 15 min chart. {image} Grtzz, Nik
Ignored
There was a double bottom off the round number which would have given an earlier entry. This is right on the highs and I'd be looking to protect myself asap if this was my trade, the idea of either partial exit or half off and smaller stop. Thats just my way and of course your idea of stop below the 1hr is just as valid (like I said though not my style staring right into the high as you are).
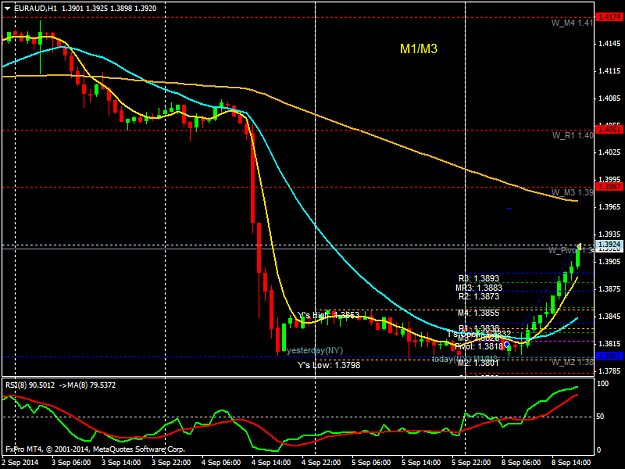
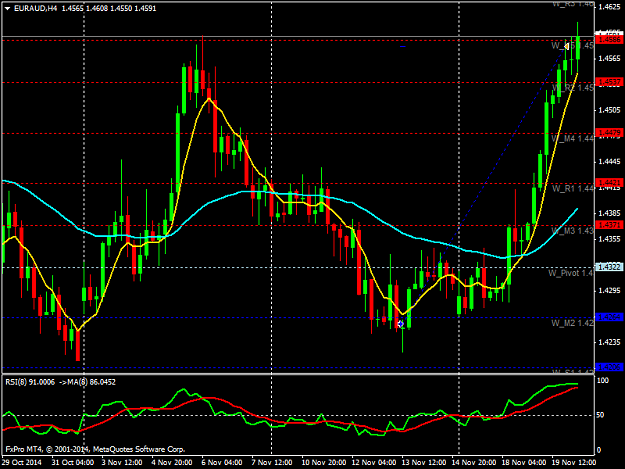
Price came down into the July/Oct lows. Hung around 1.4264 for almost a day and rejected strongly when it tried to push lower. Counter trend rules in place at the time. Entry from lower TF but showing 4hr. Exit just before the W pivot around previously identified highs for +323.