Disliked{quote} Udine, what is your definition of a "low risk, high probability set up"? and what will it look like. We keep on throwing terms and hints around but not clear definition of what it really is. Rules and setups that we have to discover for ourselves without any explanation but what are these? There are less than a handful of traders on here that post successful trades, so I think we need a bit of help here.Ignored
Ever since I saw this I wanted to reflect on this as you address a very important question. For me this is and has been the biggest issue as well, what is a 'low risk high probability setup'? How do I find them, how do I tell them apart? Okay... so the thoughts I am gonna lay now are my version of trying to define these terms, better say concepts. Just as usual anybody can take it or leave it.
Begin with a remark to your's above: the rules we don't have to discover they are laid down on page 1. The right setups, yes we do need to find. I agree usually we will establish also (additional) rules when defining the parameters of a right setup.
Okay, so this is how I take it (not all are my thoughts but of people from whom I learnt during the way). As this is a probability game you have to think in probs. Any situation, finding (statement) that occurs in a statistically significant proportion on the market may give you an edge, may increase the probs to win instead of lose.
Market is random, but still there are some very probable things about it, let's start:
(1) It has 100% probability that the prices move in waves up and down.
(2) It has 100% probability that from time to time trends (ie. price moving in a given direction for a sustained amount of time) form on the market.
(3) It has 100% probability that volatility increases then it decreases then it increases again.
(4) It has 100% probability that the lower timeframe you look at the market the lower the dimensions of the above factors become and vice versa.
(5) It has 100% probability that the more participants (money) enter the market the bigger the moves and vice versa.
Hah, you may say anyone can put such vague statements, but still I think it is not that bad to be able to list such sure things about the 'unpredictable'. Okay, let's get more specific:
(7) It is true (100% prob) that at a given TF a trend is not broken until the last period's HI or LO is exceeded by the next period.
(8) It has 90-95% probability that if one extreme (HI or LO) of the previous period is exceeded in the following period the other extreme will NOT be exceeded (allowing for 1 pip additional threshold). In other words the probability of full engulf candles is only 5-10% percent, and many of them form at news releases.
(9) It has 70% probability that if one extreme (HI or LO) of the previous period is exceeded, just in the following period price will advance in that direction 3-5 or more pips.
(10) It has 41% probability that if one extreme (HI or LO) of the previous period is exceeded, just in the following period price will advance in that direction 6 or more pips.
8, 9, 10 statements are based on calculations and statistics I made in excel about EURUSD H1 candle formations and progressions, but a quick visual backtest can also give you some sense.
Okay, so then what is a setup? A place defined by price and time where you find that price will more probably go X (5) pips in one direction than Y (10) pips in the other. Your reasoning is based on some historical data about usual/average price behavior. The setup is valid as long as all the rules that define the setup apply.
Now adding it all up (in my view but not invented by me!): In case of any setup:
(a) The probability of price going to one direction for a certain amount of time is the highest when some trend/wave is broken in the direction opposite to previous trend.
(b) Risk is the range price must go in the less probable direction in order to invalidate the setup.
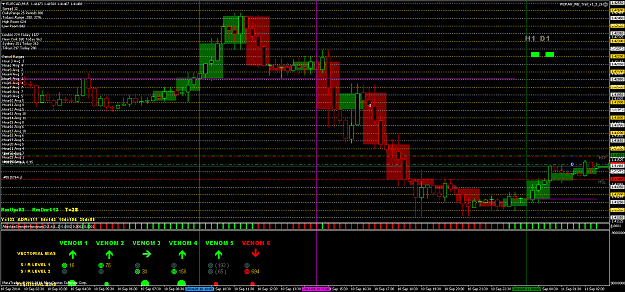
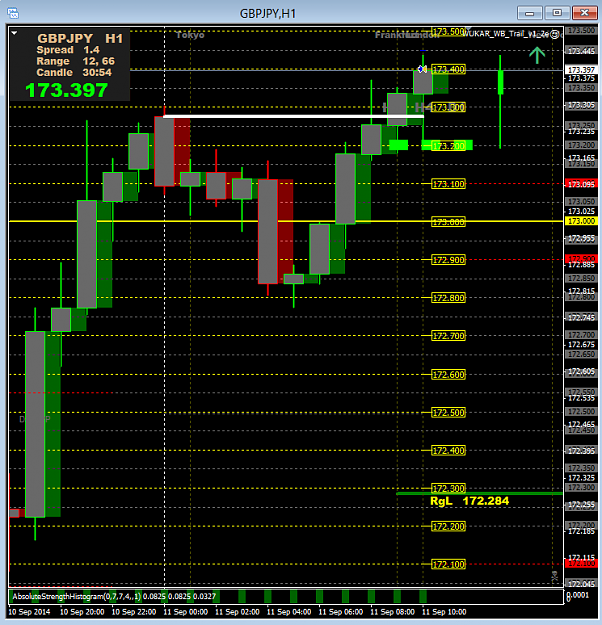
A 'naked' chart attached for illustration of most stuff discussed above.
Attached Image (click to enlarge)
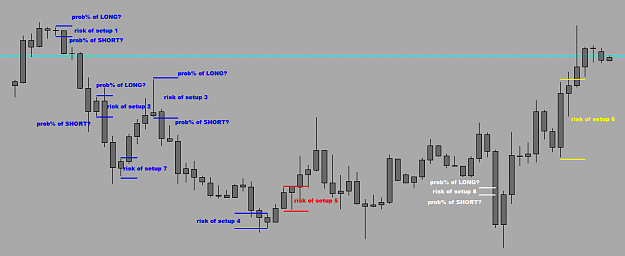
ANY place defined by price and time intersection can be a setup! But decide for yourself the yellow or the other ones have smaller risk. The same way the red and the yellow or the blue have higher probability? Or how is the probability (LONG or SHORT) of the white one with the lowest risk in the middle of the H1?
Of course you can and you should 'decorate' the probability side of the setups with any additional information about the market (red news, pivots, DO, D or W HI/LOs, etc.) but I think they are harder to quantify and statistically less significant in case of a 5 pip scalping method.
A note: you may say, hey SL is fixed 10 pips so my risk is always the same. Actually your risk depends on the inherent risk in the setup you choose as it defines the probability of the fixed 10 pip SL be hit! So 'low risk' is a shortcut to saying 'low probability of -10 pip SL be hit'.
Okay, no more short stories, good night! - Áron