Could someone please code arrows on the price chart for when the fast MA crosses the slow of an RSI? 
Both of the MA's are Exponential (8 and 21). RSI is period 14. Or is there something like this around?
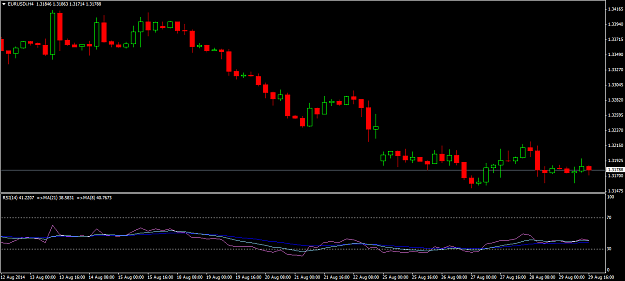
(it's the light blue and dark blue lines btw)
Both of the MA's are Exponential (8 and 21). RSI is period 14. Or is there something like this around?
(it's the light blue and dark blue lines btw)
Attached Image (click to enlarge)