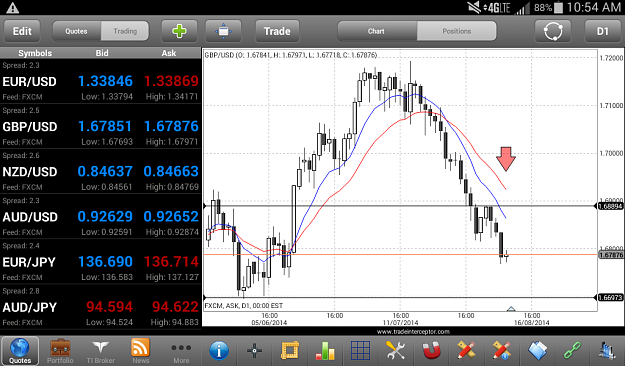
QuoteDislikedGBP/AUD
broke the support and tested it again with todays candle . Further down imho to the next support but how do you manage your entry ?
Manage the entry? Looks like you entered this trade fine. You might want to start thinking about getting out of that one now, as it's very far away from the mean value and is most likely to correct back soon to fill the gap.
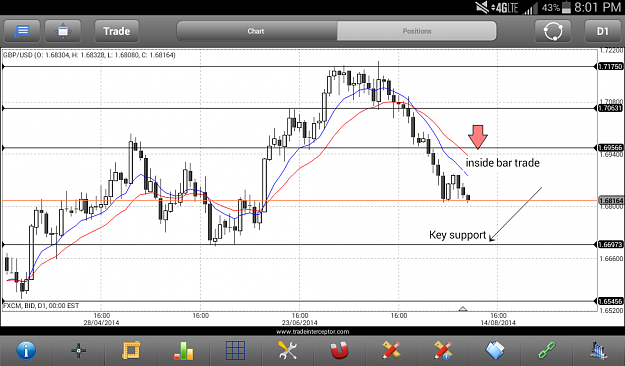
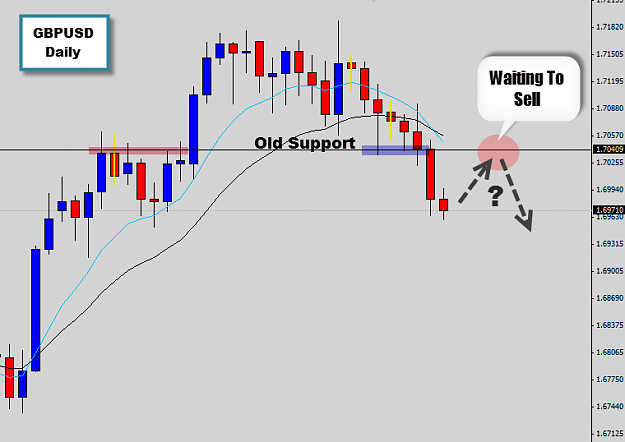
Watching out for short opportunities on the GBPUSD for next week's trading...
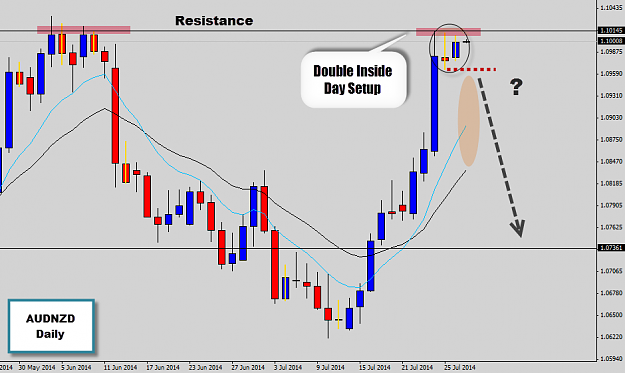
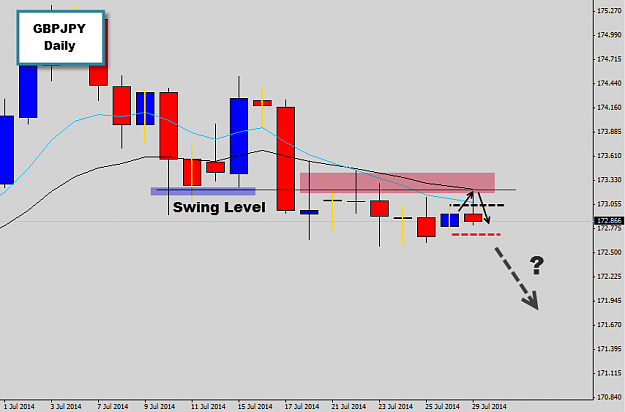
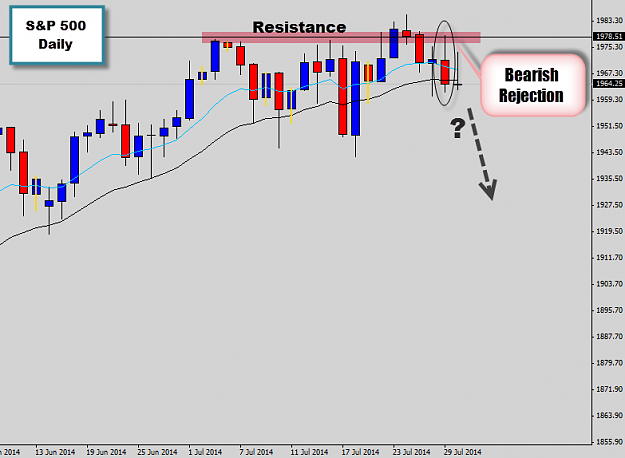
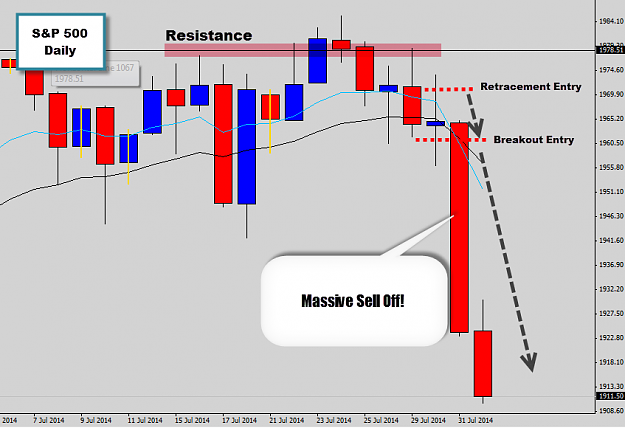
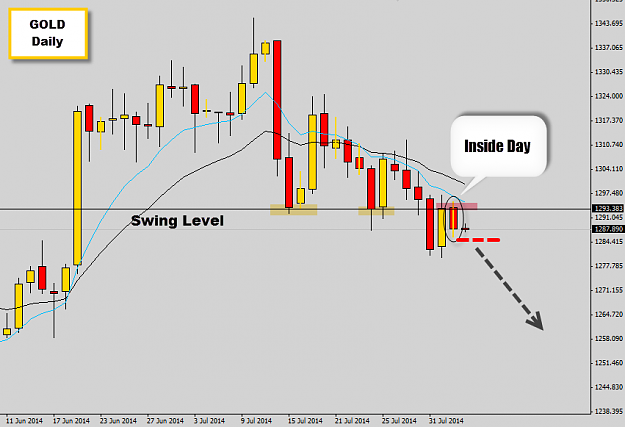
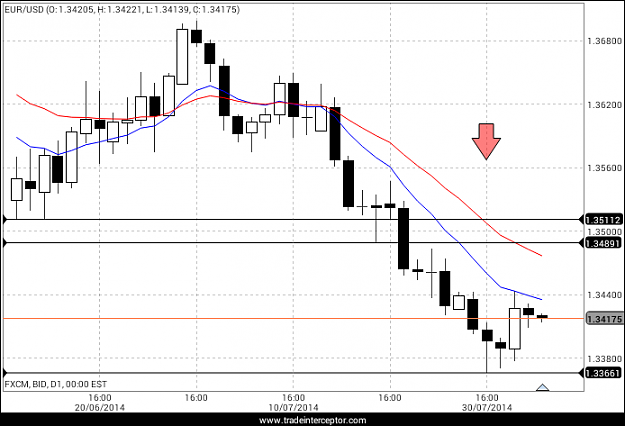
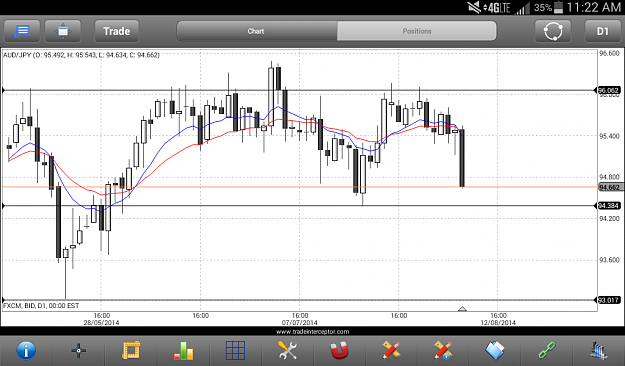
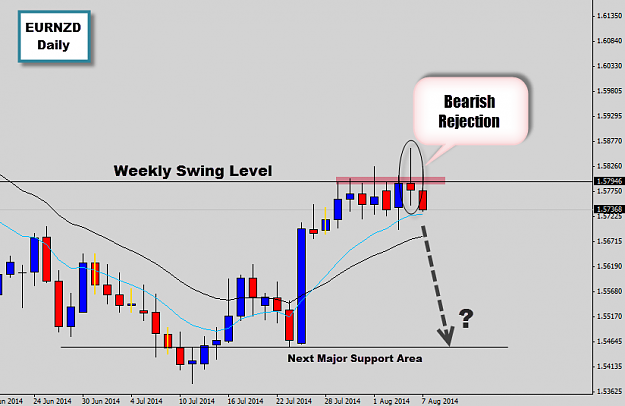
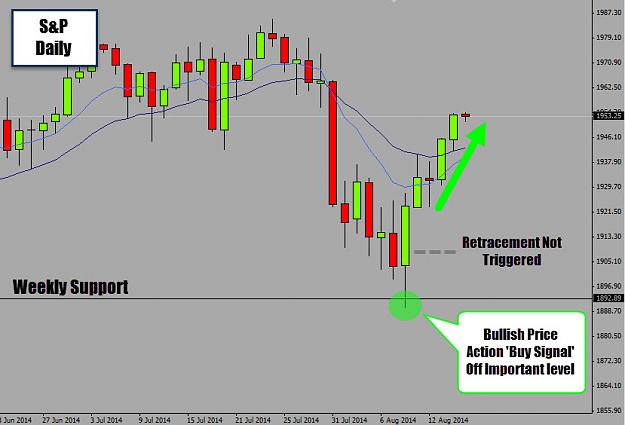
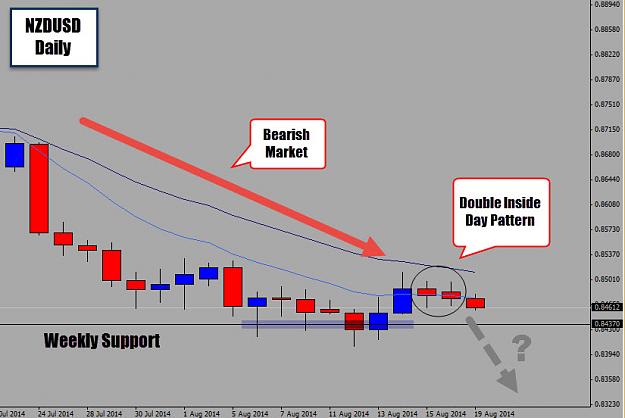
Attached Image (click to enlarge)
The Forex Guy
Obsessed with Price Action Trading, Swing Trading & Breakout Strategies