Everyone do like some patterns more than others. Here is one of my favorites, I would love to see what formations others find reliable to trade. The 3 questions are how, when, and why?
Some people only look for alternation in corrections w2 and w4. But alternation also apper in impulse waves, and i think it is very important to know, that at least one of the 3 impulses are going to be complex.
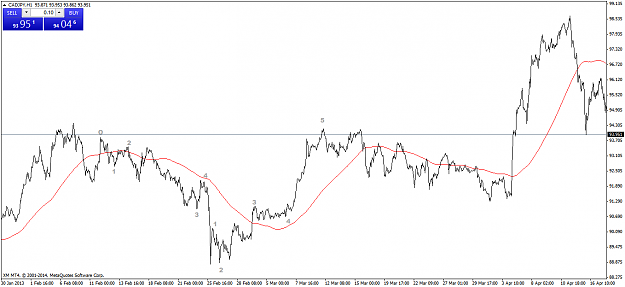
A simple w1 followed by a complex w3 after w2 is always what i am looking for. When we already had a complex impulse (w3) the chances for w5 being simple is 50/50. If both w1 & w3 are complex it is 100% sure that a simple impulse w5 will follow. BUT it is not easy to count 2 complex impulses right after each other.
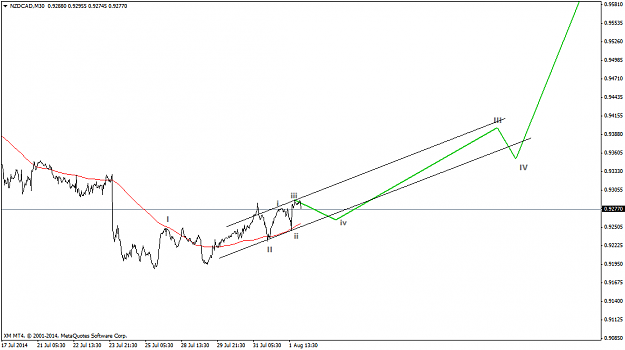
Examples and a prediction for NZD/CAD is shown below.
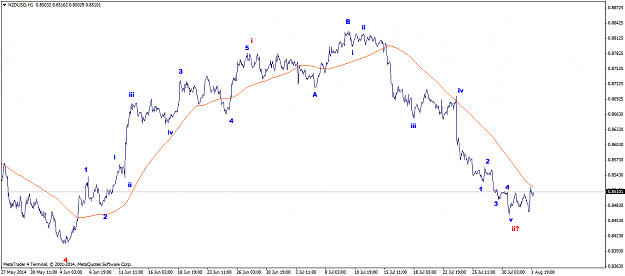
NZDUSD , i just got 140 pips and go out from the short , i prefer to wait any correction and go short again again {image}
Ignored
Hi Wayl,
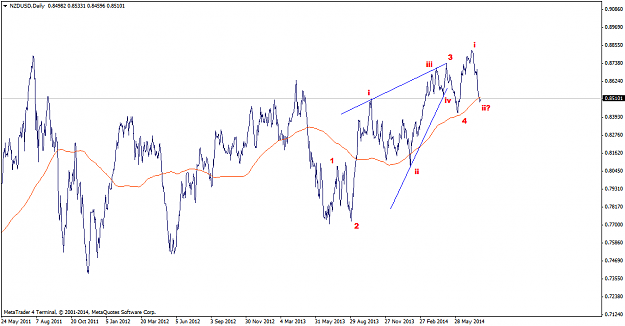
Great trade. What is nice about EW is that you can have two different analysis, that point in same direction. My count is a bit different but i was expecting the same, and now i think there will be a great reversal soon. I could be wrong, but I think this is the 1st wave of a bigger degree. NZD did also loose against all other currencies on the moment they did raise interest rates from 3.25% to 3.50% (as expected). But i don't think that this reverse effect was expected. Some would justify the move by saying rates didn't break the expectations, but so it did not the last few times they raised it but the impacts were positive on NZD back then. I think NZD is back, who would agree or disagree?
Hi folks, Everyone do like some patterns more than others. Here is one of my favorites, I would love to see what formations others find reliable to trade. The 3 questions are how, when, and why? Some people only look for alternation in corrections w2 and w4. But alternation also apper in impulse waves, and i think it is very important to know, that at least one of the 3 impulses are going to be complex. A simple w1 followed by a complex w3 after w2 is always what i am looking for. When we already had a complex impulse (w3) the chances for w5 being...
Ignored
What you have actually spotted in terms of the "complex w3" is that really they develop in 3-waves and not 5. If you use that throughout (because you're mixing them up) you'll find things much easier to follow but you need to be aware that alternation is not only about complexity but depth.
No I haven't got the wave structure wrong! I've corrected it!
For me they look all like fives. The perfect count do not exist overlaps will happen between w2 and w4 in early stages. I use line charts to filter as much noise as possible.
For me they look all like fives. The perfect count do not exist overlaps will happen between w2 and w4 in early stages. I use line charts to filter as much noise as possible.
Ignored
Overlaps would not occur if you know how to measure waves that need to be from extreme to extreme... but not necessarily swing highs/lows...
No I haven't got the wave structure wrong! I've corrected it!
Sorry didn't mean "will" but it can happen. But my observations tells me that they happen and especially in smaller time frames. But they often disappear when you look at bigger frames. But only if you use line charts.
Sorry didn't mean "will" but it can happen. But my observations tells me that they happen and especially in smaller time frames. But they often disappear when you look at bigger frames. But only if you use line charts.
Ignored
Take a look at how alternation works... depth and complexity...
Attached Image (click to enlarge)
No I haven't got the wave structure wrong! I've corrected it!
I must admit after looking at this chart for 20 mins the only thing i get is -i- to -v-. But in my coun't -v- would not be made up of a 3 waves, and therefor i can't agree on wave -v-. I also find it superfluous to label almost straight waves, as it distracts me alot, but you seem to do fine like that.
I must admit after looking at this chart for 20 mins the only thing i get is -i- to -v-. But in my coun't -v- would not be made up of a 3 waves, and therefor i can't agree on wave -v-. I also find it superfluous to label almost straight waves, as it distracts me alot, but you seem to do fine like that.
Ignored
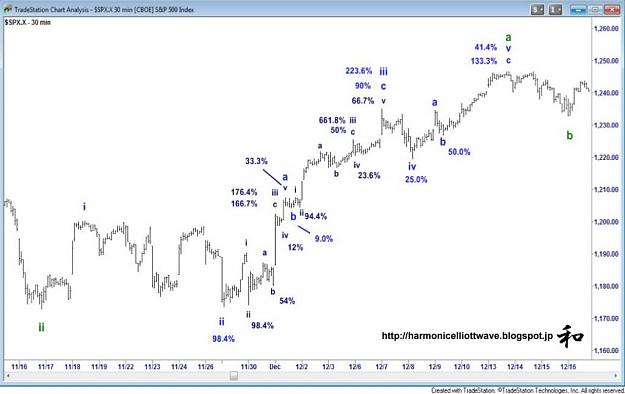
As you wish, but I forecast that rally almost perfectly... I started with the DOW in July 2010 and forecast the DOW would reach 12,600+/- 200 points and drop 20% before going up to 14K again.
I started forecasting the S&P at the Wave (b) to the bottom left. 2-days before the (green) Wave iii (just above where it has 85.4% / 223.6%) I forecast that high, the (green) Wave iv, the Wave -iii-, Wave -iv- ... the next high being the equivalent of the DOW target. On the way down in the S&P I called a maximum low at 1,076.
"I also find it superfluous to label almost straight waves"
If you go down to the lower degree, they aren't straight - and that's one of the failings people make.
No I haven't got the wave structure wrong! I've corrected it!
{quote} As you wish, but I forecast that rally almost perfectly... I started with the DOW in July 2010 and forecast the DOW would reach 12,600+/- 200 points and drop 20% before going up to 14K again. I started forecasting the S&P at the Wave (b) to the bottom left. 2-days before the (green) Wave iii (just above where it has 85.4% / 223.6%) I forecast that high, the (green) Wave iv, the Wave -iii-, Wave -iv- ... the next high being the equivalent of the DOW target. On the way down in the S&P I called a maximum low at 1,076. "I also find it superfluous...
Ignored
Thats well done i must say. Isn't this the method TS Hennessey (correct me if i am wrong) discovered? Do you never use ordinary EW?
{quote} Thats well done i must say. Isn't this the method TS Hennessey (correct me if i am wrong) discovered? Do you never use ordinary EW?
Ignored
I've never heard of TS Hennessy. I doubt it's the same. The ratio methodology is something I discovered when trying to identify where the wave relationships lie. I never use traditional EW for the impulsive sequence. I do use the corrective structures (Elliott's observations were nothing but brilliant) - but still only with the Wave A and Wave C as 5-waves, internally constructed of 3-waves.
I just think Elliott made a misjudgment with the impulsive sequence because he couldn't research wave relationships thoroughly. He had to do all calculations long hand and probably didn't have hourly charts (though I'm not sure.) I used a calculator when I discovered the pattern of relationships. I now use a spreadsheet to be able to match the Wave v targets with the Wave -c- / -iii- targets and to estimate potential Wave -iii- targets bearing in mind where the higher degree Wave (iii) targets may be.
Just had a look at Infinitus' link. It looks like Hennessy saw a similar thing - that the middle part (which Elliott described as extended waves) - can get complicated with deep retracements (which I call deep Wave b / iii's) but hasn't quite slotted them together in the same way. With my adjustments, basically the structure is consistent and avoids extended waves, failed fifths and leading/ending triangles... It also copes with all these incredibly long "running triangles/corrections" which really are a factor of the wrong structure.
The toughest part of HEW is the identification of waves in noisy/slow developing markets. This has been happening this year with the days' ranges slipping to incredibly low levels. Interestingly, whenever that's happened in the past, at some point there is an explosion that provokes an equally incredible trend. I think that's still a few months (3-6?) away though... unfortunately.
No I haven't got the wave structure wrong! I've corrected it!
What i understand is that you count 1-2-(a-b-c)-4-5 instead of 1-2-3-4-5. And this is how you allow 4 wich is b to overlap 2 wich is 2 in both. And the (a-b-c) between 2 and 4 is the extension so we actually get a 7-wave formation in a way. I have also a couple times of tried to make different counting styles but lost interest and didn't follow up on any of them. And I remember thinking 5-waves looked like 7-waves so its fun looking at your charts now, at least think I understand what your point is. Great work.
What i understand is that you count 1-2-(a-b-c)-4-5 instead of 1-2-3-4-5. And this is how you allow 4 wich is b to overlap 2 wich is 2 in both. And the (a-b-c) between 2 and 4 is the extension so we actually get a 7-wave formation in a way. I have also a couple times of tried to make different counting styles but lost interest and didn't follow up on any of them. And I remember thinking 5-waves looked like 7-waves so its fun looking at your charts now, at least think I understand what your point is. Great work.
Ignored
Not quite.
Wave 1, Wave 3 and Wave 5 are all (a)(b)(c) moves if you look at the chart above, where it was possible to identify them on the chart, they are subdivided in 3-waves. In the rally from the green Wave ii just after the mini Wave -b- (which was the first time I'd seen this - and wondered whether I'd got the count right) there is a navy count that has no Wave a & b of iii. This is the 30-min chart showing the break down and ratios. Even then, it's difficult to slot in some of the Wave b / v because they're mini-minor and these do provide problems at times!
Attached Image (click to enlarge)
No I haven't got the wave structure wrong! I've corrected it!
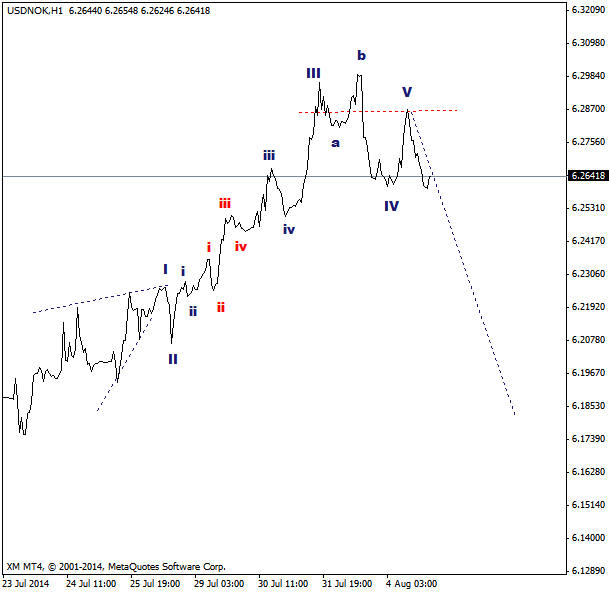
Ian look, i think think this is a 5th wave failure but time will show. {image}
Ignored
I can't make any comment about the count except, obviously, that it's not in the structure I use. I will say that bar extremes are important and that's where the wave relationships lie - unless the key highs/lows in the lower degree get eaten up by the higher degree. (ie a 5 min correction over (say) 5 bars will not be seen in the hourly bar. )
I also have strict rules on wave ratios. For example, the minimum Wave iii is 176.4%. (every now and then falls short by 1%-2% but it's rare. There are also wave projection cluster areas, so any old ratio is not acceptable. The Wave v must match a higher degree Wave -iii- etc. So without measuring, I couldn't comment on the count except it's not what I use.
No I haven't got the wave structure wrong! I've corrected it!
Ian ".....every now and then falls short by 1%-2%...." 'Page 78' suggests a bit more than this. Any update needed ?
Ignored
Crikey! When I started writing the book I hadn't fully worked out the ratio structure but knew that the 3-wave moves were definite. I do recall using 138.2% and a few below 176.4% event before writing the book so it looks like I had gotten to that stage before it all clicked. When I got to the point of comparing standard EW and HEW ratios the 176.4% minimum became apparent...
Thank you for pointing that out... That needs a re-write...
No I haven't got the wave structure wrong! I've corrected it!