Quick question about the new daily MD system, does the yellow dot have to be inside MA lines or can it be on opposite side of the trend?
Ignored
Mmmm..you should better understand what the yellow dots indi means...i explain:
In MD the important thing is that the lining up of MAs is good (yellow red white or viceversa..and possibly not flat but with an angle) and agreement of all other indis.
The yellow dot HAS TO BE opposite of the direction of trend, cause this system uses the retracments in a trend to spot good entries, jumping back in the trend again (you could try to use Yellow dots, in other ways...but at your own risk!) Don't be confused by the use of yellow dot in MTS!!!!!!
In MTS usually we watch at them as shields,with the task to tell us: "STOP!NO TRADE.. danger! We are near a TOP (if yellow ball above the candle) or near a BOTTOM (if yellow ball below the candle)".
{quote} Mmmm..you should better understand what the yellow dots indi means...i explain: In MD the important thing is that the lining up of MAs is good (yellow red white or viceversa..and possibly not flat but with an angle) and agreement of all other indis. The yellow dot HAS TO BE opposite of the direction of trend, cause this system uses the retracments in a trend to spot good entries, jumping back in the trend again (you could try to use Yellow dots, in other ways...but at your own risk!) Don't be confused by the use of yellow dot in MTS!!!!!!...
Ignored
Thanks cariddi, i do know what their function is in each template, but you didnt answer what i asked, I asked in this MD daily template does the yellow dot have to be inside of the moving average tunnel for us to take a trade or can it be out of it on the opposite side of the trend?
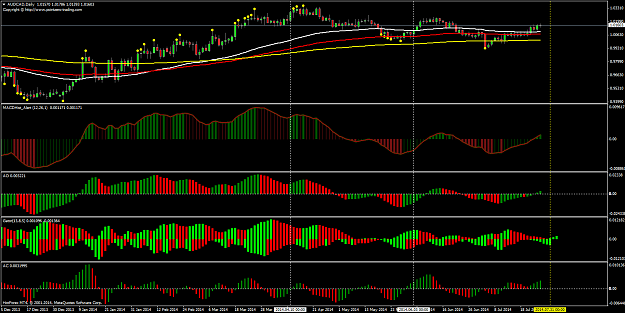
NO. Don't be confused by the projection of the Gator indi!!!!!!!!!!!!! It works similar to the Ichimoku cloud of the old MD...it paints today, but also it paint a "projected" future 5 bars.
All indicators have to lined up AT THE CLOSE OF THE CURRENT CANDLE (just use the vertical line tool in MT4 to not making mistakes)
AUD/CAD can be a valid LONG (as per strictly following the MD trend catcher rules) at the close of the candle of 07.31.2014 (gator does not repaint projection too, except the last projected bar...until closed). So in that date if all still in agreement (even MA's that might become messy if there is sudden shock movements), we can take the LONG CORRECTION ABOUT THE CANCELLED PARTS HERE..SORRY : http://www.forexfactory.com/showthread.php?p=7635718#post7635718
{quote} Thanks cariddi, i do know what their function is in each template, but you didnt answer what i asked, I asked in this MD daily template does the yellow dot have to be inside of the moving average tunnel for us to take a trade or can it be out of it on the opposite side of the trend?
Ignored
What tunnel? There's no (purple or any color) tunnel in my MD template..just the 3 Ma yellow, red and white
Ok, if mean as tunnel the space between the MAs: if you understood well (as i hope) which side yellow dot watching out for the pre-signal let's say...well the yellow dot can be anywhere.
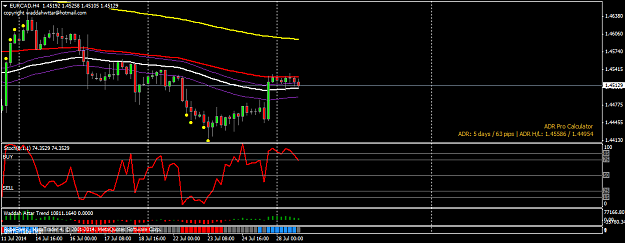
{quote} Thats what i meant, please take a look at image below {image}
Ignored
The distance of yellow dot is calculated by parameters inside the indicator...it means NOTHING if you see it glued to the bottom of a candle or far from that.
JUST LOOK THAT IT'S BELOW THE CANDLE AND NOT ABOVE (for a possible long as in the case of the screenshot). That's the only thing that matters.
{quote} The distance of yellow dot is calculated by parameters inside the indicator...it means NOTHING if you see it glued to the bottom of a candle or far from that. JUST LOOK THAT IT'S BELOW THE CANDLE AND NOT ABOVE (for a possible long as in the case of the screenshot). That's the only thing that matters.
{quote} The distance of yellow dot is calculated by parameters inside the indicator...it means NOTHING if you see it glued to the bottom of a candle or far from that. JUST LOOK THAT IT'S BELOW THE CANDLE AND NOT ABOVE (for a possible long as in the case of the screenshot). That's the only thing that matters.
Ignored
tha first green candel of gator NOW is 31\7
so we have to wait unitl 31\7 in order to see if go or not to go long?
{quote} NO. Don't be confused by the projection of the Gator indi!!!!!!!!!!!!! It works similar to the Ichimoku cloud of the old MD...it paints today, but also it paint a "projected" future 5 bars. All indicators have to lined up AT THE CLOSE OF THE CURRENT CANDLE (just use the vertical line tool in MT4 to not making mistakes) AUD/CAD can be a valid LONG (as per strictly following the MD trend catcher rules) at the close of the candle of 07.31.2014 (gator does not repaint projection too, except the last projected bar...until closed). So in that...
if Tomorrow MD syst give l'ok(all green) for a long of AN can we open another long?(i 'm already inside in a long by MS syst)
Ignored
At the CLOSE of tomorrow daily candle,if all still so lined up, i think yess....with GRIN face (me too already in AU/NZD, for the entry taken a couple of days ago with the first MD system..the one with the cloud). Ahahah
Also beware at your money managment (or think about closing overleveraged postion, if any..just a personal suggestion), cause as Davit remembered us, Friday there is NFP and other big crap red news.. so price can go a bit crazy; i know it is just monday today...well...
{quote} At the CLOSE of tomorrow daily candle,if all still so lined up, i think yess....with GRIN face (me too already in AU/NZD, for the entry taken a couple of days ago with the first MD system..the one with the cloud). Ahahah Also beware at your money managment (or think about closing overleveraged postion, if any..just a personal suggestion), cause as Davit remembered us, Friday there is NFP and other big crap red news.. so price can go a bit crazy; i know it is just monday today...well...
Ignored
Im putting my house on that trade, and buying an island next week
|
Membership Revoked
|
Joined May 2009
|1,419 Posts
Ok. Checked Gator indi better. It can repaints the projection candles (more than one), so forget about my story about the 31.07 trade for AUD/NZD in a previous post (also i cancelled the wrong parts into that post ) ...AUD/NZD can still really can be triggered,of course (very possible), but.... JUST take into consideration the Current Candle lining up (once closed of course).
Simple..i was overcomplicating things
|
Additional Username
|
Joined Apr 2014
|1,312 Posts
"(me too already in AU/NZD, for the entry taken a couple of days ago with the first MD system..the one with the cloud). Ahahah "
i cant remember u postin ur chart here