AUD pairs are showing potentials for nice shorts into rallies especially AUDCHF and AUDCAD. Both AUD weakness vs CAD and CHF can be reflected on charts. AUDCAD can also be good for shorting around 1.0095. As we can see a nice zig zag and strong H4 CAM and 50.0 fib confluence. MACD also shows a retracement while the first target -1.0047 need to break for the next level 1.0032 and 1.0005. {image}
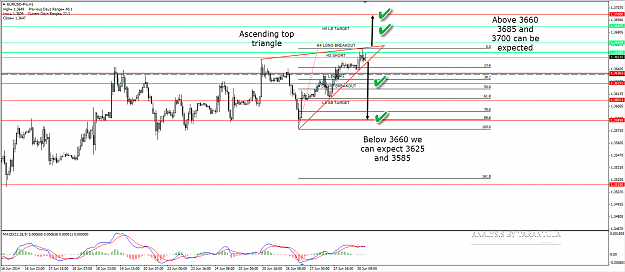
Here is LEVEL analysis of EURUSD as today is Monday and we have yet to see NY action. 3660 is important level today. EURUSD is contained within Ascending top triangle and above 3660 targets are 3685 and 3700. Below 3660 we could see 3625 and 3585.
Here is LEVEL analysis of EURUSD as today is Monday and we have yet to see NY action. 3660 is important level today. EURUSD is contained within Ascending top triangle and above 3660 targets are 3685 and 3700. Below 3660 we could see 3625 and 3585. {image}
CHFJPY is showing nice trending pattern with a steep intraday trendline. First POC stands around 23.6 fib which is not a deep retracement but due to a previous swing high it makes a POC. ( 114.30 region). POC2 stands around 114.05-00 and we can see a triple confluence there. Due to a steep trendline and breakout of previous high 114.30 zone could give a chance to long towards 114.95.
i followed this topic some months, it ís so great. Thank for good guy. But I still do not understand how to you can find out the orientation ( up, down, or not change) to make the decision: sale or buy. Please explant for me. Thank you so much.
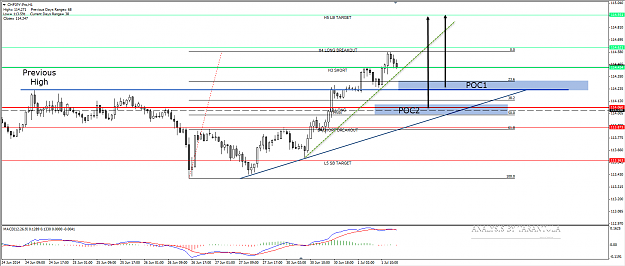
NZDUSD is currently at the top of developing right shoulder and we might use POC1 or POC2 for shorting opportunities. POC1 is fib, dpp and potential Right shoulder top confluence, while POC2 is H3 and 88.6 deeper last swing retracement confluence. Target is 8730-25 region. Fundamentally both AUD and NZD last news releases support a technical downtrend.
NZDUSD is currently at the top of developing right shoulder and we might use POC1 or POC2 for shorting opportunities. POC1 is fib, dpp and potential Right shoulder top confluence, while POC2 is H3 and 88.6 deeper last swing retracement confluence. Target is 8730-25 region. Fundamentally both AUD and NZD last news releases support a technical downtrend. {image}
i followed this topic some months, it ís so great. Thank for good guy. But I still do not understand how to you can find out the orientation ( up, down, or not change) to make the decision: sale or buy. Please explant for me. Thank you so much.
Ignored
Thanks for comments. Its CAMMACD method. Its impossible to explain it this way.
hi all good guy. i am sorry that i can not fid out the orientation, up to find buy point, down to find point sale. how can you identify the orientation? can you give me some example ?
hi all good guy. i am sorry that i can not fid out the orientation, up to find buy point, down to find point sale. how can you identify the orientation? can you give me some example ?
Ignored
download the camarilla indicator and put those levels on a 1hr chart. You need to read up on what those levels mean. Try investopdia or something like that. That would give you a basic understanding of the levels. I cannot teach you what I don't know myself but if you learn that and have an understanding of price action you will start to get it.
Hi
By looking to some pairs i see we will get one more leg up
g/u 1.73xx
nzd/u long 8765 target 88 sl 8750
e/u sell the top "still one leg to up will do"
CHFJPY is showing nice trending pattern with a steep intraday trendline. First POC stands around 23.6 fib which is not a deep retracement but due to a previous swing high it makes a POC. ( 114.30 region). POC2 stands around 114.05-00 and we can see a triple confluence there. Due to a steep trendline and breakout of previous high 114.30 zone could give a chance to long towards 114.95. {image}
{quote} download the camarilla indicator and put those levels on a 1hr chart. You need to read up on what those levels mean. Try investopdia or something like that. That would give you a basic understanding of the levels. I cannot teach you what I don't know myself but if you learn that and have an understanding of price action you will start to get it.
Hi By looking to some pairs i see we will get one more leg up g/u 1.73xx nzd/u long 8765 target 88 sl 8750 e/u sell the top "still one leg to up will do"
NZDUSD is currently at the top of developing right shoulder and we might use POC1 or POC2 for shorting opportunities. POC1 is fib, dpp and potential Right shoulder top confluence, while POC2 is H3 and 88.6 deeper last swing retracement confluence. Target is 8730-25 region. Fundamentally both AUD and NZD last news releases support a technical downtrend. {image}
Ignored
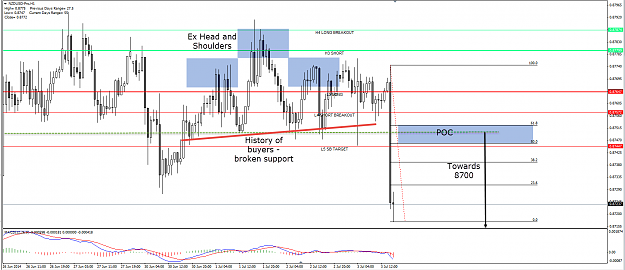
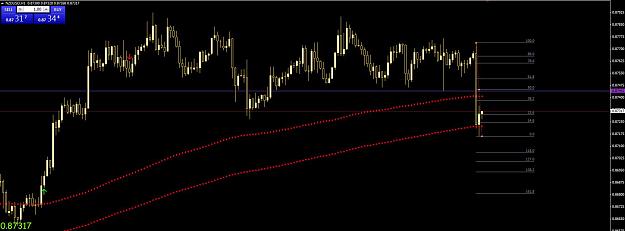
+50 pips on yesterday's NZDUSD setup and here is addendum. I may be looking for a possible new sell around 8750 towards 8700 and 8680 if the price pullbacks. We have strong down candles with wicks in the area of previous head and shoulders , historical support and fib confluence. 8780 must hold if 8750 is touched for a complete downward target.
{quote} +50 pips on yesterday's NZDUSD setup and here is addendum. I may be looking for a possible new sell around 8750 towards 8700 and 8680 if the price pullbacks. We have strong down candles with wicks in the area of previous head and shoulders , historical support and fib confluence. 8780 must hold if 8750 is touched for a complete downward target. {image}
Ignored
Thanks T! I have a fib pulled on the 15m, watching the levels and structure to the left. I would like to sell from there as well. I had sold this pair before the news for a scalp. need a re-entry.