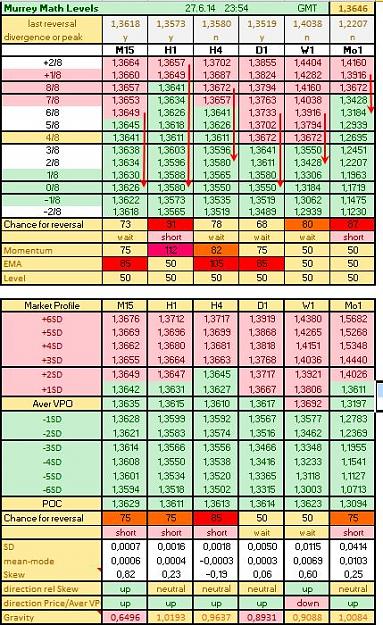
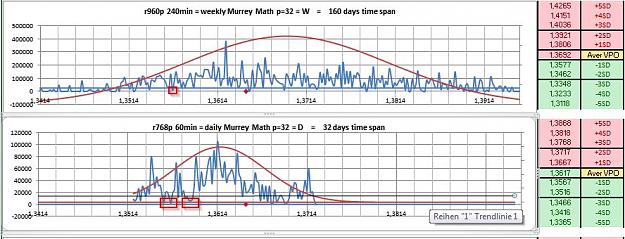
EU Murrey Math levels and direction out of my view it may crawl a bit more up before a drop occurs, at least toward 3626 or 3611 Extended moves towards 3580 and 3550 possible {image}
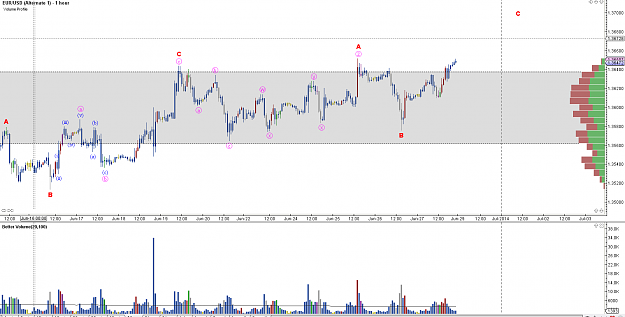
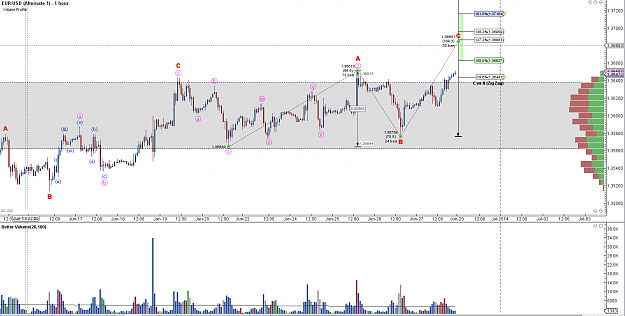
{quote} lets see i bet 90% are wrong ! here for you intermarktet price with better voulume incl. my ew count. C wave (red) you know @100% or 161% {image}
Ignored
thanks my friend
the indicator on the right side of the chart: volume per price? what means red and green? can you tune it finer?
{quote} cool, I like the division in up and down volume which charting platform is this? play a bit with the "20 bars with 100" - the finer the blocks get, the better and more precise is the information
Ignored
here 100% and 161.8%
this is ew style
but i prefer my norm trades for TP as i have posted before here in your thread
{quote} cool, I like the division in up and down volume which charting platform is this? play a bit with the "20 bars with 100" - the finer the blocks get, the better and more precise is the information
{quote} ich bin kein volume guru - und ich kenne mich da nicht so aus wie du bzw. ich komme mit deinen roten punkten nicht ganz klar - heißt das immer das der kurs dort hinkommen sollte ? thanx
Ignored
also, meine Volumenprofile sind in etwa das, was Du auf Deinem Chart auf der rechten Seite siehst.
Interessant sind dabei immer folgende Merkmale:
no-business-zones oder LVN (low volume nodes): hier fanden sich in der Vergangenheit keine Käufer/Verkäufer - diese Zonen haben hohes Rückschlagpotential
diese Zonen werden in der Regel nicht auf dem ersten "run" durchschlagen
POC's oder HVN (high volume nodes): hier wurde in der Vergangenheit rege gehandelt. Wenn der Preis diese HVN erreicht, läuft er oft auch weiter, nämlich in den nächsten LVN hinein. HVN haben eine hohe Anziehungskraft. Klar, hier wurde ja auch in der Vergangenheit rege gehandelt.
Also, eine typische Distribution weist ja vereinfacht gesehen folgende Merkmale auf:
LVN - HVN - LVN
Die Marktteilnehmer versuchen immer die Handelsspanne auszuloten: der Preis wird sich also ideal zwischen den beiden LVN bewegen.
Angenommen, Du bist am unteren LVN short gegangen. Der Preis bewegt sich nun aber Richtung HVN, und dann sogar weiter zum oberen LVN.
Strategie wäre nun, den SL der Position hinter den oberen LVN zu legen, und sogar noch zusätzlich den Preis beim oberen LVN zu shorten.
Ich markiere in der Regel die LVN. Manchmal auch die HVN, wenn die besonders groß und interessant sind.
Manchmal markiere ich auch einen ganzen Bereich, wenn dieser in einer größeren Gausschen Verteilung eine eigene Gaussche Verteilung zu bilden scheint.
Aus meiner Sicht macht es am meisten Sinn, die LVN's zu counter-traden. Der TP sollte dabei idealerweise in der Nähe des HVN liegen.
Hier wetten wir also auf mean-reverting. Ein HVN ist ja auch oft der Mittelpunkt der Gausschen Verteilung.
Wenn Du noch mehr Fragen hast, dann schieß los......
{quote} also, meine Volumenprofile sind in etwa das, was Du auf Deinem Chart auf der rechten Seite siehst. Interessant sind dabei immer folgende Merkmale: no-business-zones oder LVN (low volume nodes): hier fanden sich in der Vergangenheit keine Käufer/Verkäufer - diese Zonen haben hohes Rückschlagpotential diese Zonen werden in der Regel nicht auf dem ersten "run" durchschlagen POC's oder HVN (high volume nodes): hier wurde in der Vergangenheit rege gehandelt. Wenn der Preis diese HVN erreicht, läuft er oft auch weiter, nämlich in den nächsten...
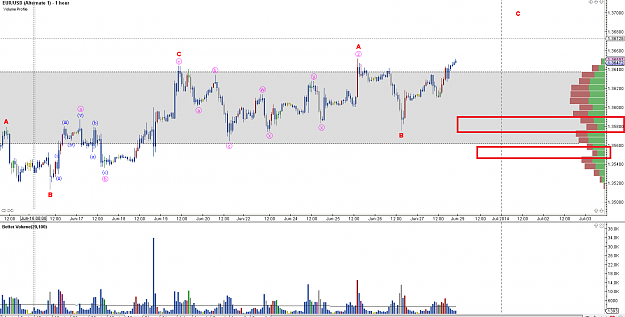
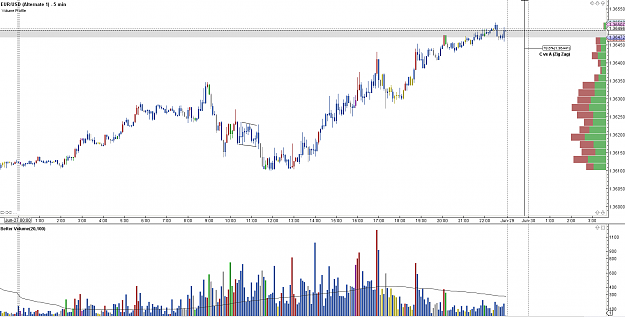
{quote} using correct charts is the key of forex trading i say it always - incl. micro gaps etc... pp here we go with 5min chart incl. better voulume candle sticks {image}
{quote} also, meine Volumenprofile sind in etwa das, was Du auf Deinem Chart auf der rechten Seite siehst. Interessant sind dabei immer folgende Merkmale: no-business-zones oder LVN (low volume nodes): hier fanden sich in der Vergangenheit keine Käufer/Verkäufer - diese Zonen haben hohes Rückschlagpotential diese Zonen werden in der Regel nicht auf dem ersten "run" durchschlagen POC's oder HVN (high volume nodes): hier wurde in der Vergangenheit rege gehandelt. Wenn der Preis diese HVN erreicht, läuft er oft auch weiter, nämlich in den nächsten...
Ignored
Vielen Dank für deine Erklärung.
Ich habe mir einen Authisten eingestellt der mir die EWs counted. Der macht es mehr wie gut. Der liest die Wellen ohne Fibos und ich sehe die Wellen nicht die er sieht. Ich möchte mich nicht mit anderen Sachen beschäftigen wie volume etc. Trotzdem vielen Dank für Deine Erkärung. Ich schaue oft drüber aber ich komme nicht damit klar, da viele Bücher auf englisch sind und mein Englisch ist nicht das beste. Trotzdem Danke ......
Das Problem ist es er trinkt kein Bier und redet wenig :-) . ER schickt mir alles per mail ich muss es dann entscheiden. Aber er macht einen perfekten job.
Unglaublich aber wahr. So ist das Geschäft = Er sieht sogar jeden gschissenen GAP auf dem M1 chart und projiziert mir dann den Chart.
Ich habe ein juwel hier in meinem Büro.
Aber: Er raucht nicht, er fickt nicht, er sauft nicht ---> und er macht seinen Job perfect.
Ich habe noch eine Lebensaufgabe = Ihn ins PUFF zu bringen.