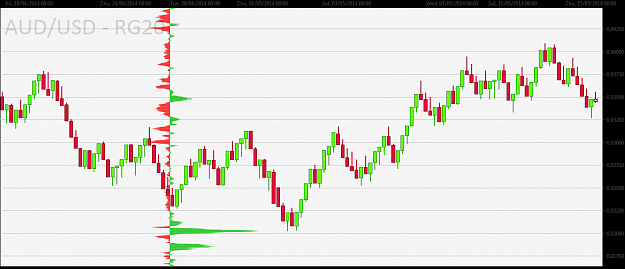
• Home
  • Forums
  • Trades
  • News
  • Calendar
  • Market
  • Brokers
  • Login
  • Join
  • User/Email: Password:
  • 3:51am
Menu
  • Forums
  • Trades
  • News
  • Calendar
  • Market
  • Brokers
  • Login
  • Join
  • 3:51am
Sister Sites
  • Metals Mine
  • Energy EXCH
  • Crypto Craft

Options

Bookmark Thread

First Page First Unread Last Page Last Post

Print Thread

Similar Threads

How to flow with the order flow? 26 replies

What is order flow trading? 90 replies

Supply demand trading and order flow 45 replies

Domino's Price and order flow trading 1,400 replies

Order Flow Trading with ICCE Channels 3 replies

  • Trading Discussion
  • /
  • Reply to Thread
  • Subscribe
  • 18
Attachments: Order flow trading thread
Exit Attachments

Order flow trading thread

  • Last Post
  •  
  • 1 45Page 678 9
  • 1 5Page 67 9
  •  
  • Post #101
  • Quote
  • May 15, 2014 1:12pm May 15, 2014 1:12pm
  •  PipMeUp
  • Joined Aug 2011 | Status: Member | 1,305 Posts
Quoting saneblane
Disliked
{quote} That's an interesting profile there, knowing where the most activity can help you a lot. This information could be useful for the traders who flip a coin and use tight stops, I never really looked into market profile much, but in a sense what I am doing is profiling also, just from a different perspective. It seems we all have the same questions just trying to answer them in different ways.
Ignored
Just looking at the picture... The big red spike is coincident with an obvious S/R. After it is broken, the green bump just above looks like a good place to set a buy limit and the green bump below would have been a decent place to hide a SL the other side. (The retest is in the future for the indicator on this image). So not a coin flip because you buy a well know bullish pattern (Resistance Breakout Retest Continuation).

=> I don't know if it is real or not. It is only one single occurence, not statistically significant at all.

I should investigate more...
No greed. No fear. Just maths.
 
 
  • Post #102
  • Quote
  • May 15, 2014 1:20pm May 15, 2014 1:20pm
  •  saneblane
  • Joined Jun 2013 | Status: Member | 475 Posts
Quoting PipMeUp
Disliked
{quote} Just looking at the picture... The big red spike is coincident with an obvious S/R. After it is broken, the green bump just above looks like a good place to set a buy limit and the green bump below would have been a decent place to hide a SL the other side. (The retest is in the future for the indicator on this image). So not a coin flip because you buy a well know bullish pattern (Resistance Breakout Retest Continuation). => I don't know if it is real or not. It is only one single occurence, not statistically significant at all. I should...
Ignored

You're the 100th poster on my thread, so today is your lucky day. Go play the lottery before your luck runs out.

And on another note, Yayyyyyy My thread made 100 post didn't know there would be any interest.

And on another note again, Ok, It looks good, but to be useful it would have to be consistent in the information it provides. It doesn't have to be right all the times though just about 60 percent would do. The issue is to find the best start and stop point to use, at what point does the data becomes irrelavant? that a whole other topic and would need research, it would show a very different information if it shows it for a week or a month or an hour, and which one would be more valid would be another issue. But it does look promising.
Being a trader is lonely, but being a great trader is lonelier still
 
 
  • Post #103
  • Quote
  • May 15, 2014 1:43pm May 15, 2014 1:43pm
  •  srmfx
  • Joined Nov 2007 | Status: Member | 1,929 Posts
Quoting saneblane
Disliked
{quote} Nice example, that's a clear cut trade. The taking profits and then the huge buying that came onto that demand zone was a clear cut situation of buying pressure. The 5 minute chart is not my forte though, my concentration is not good enough down there to trade on a chart. And it seems you look out for news for your flow, that's something I don't really pay attention too either, but I am going to do it soon and see how often money flow correlates with sentiment.
Ignored
The initial reaction to a major news provides the perfect liquidity for the beginning of the squeeze. Probably some small stops below 1.3650 were used for the same purpose.
I draw my road maps every morning and determine the levels with large orders. Then I read the news to confirm the levels.
 
 
  • Post #104
  • Quote
  • May 15, 2014 1:47pm May 15, 2014 1:47pm
  •  saneblane
  • Joined Jun 2013 | Status: Member | 475 Posts
Quoting srmfx
Disliked
{quote} The initial reaction to a major news provides the perfect liquidity for the beginning of the squeeze. Probably some small stops below 1.3650 were used for the same purpose. I draw my road maps every morning and determine the levels with large orders. Then I read the news to confirm the levels.
Ignored
Oh I see gotcha, make sense.
Being a trader is lonely, but being a great trader is lonelier still
 
 
  • Post #105
  • Quote
  • May 15, 2014 2:06pm May 15, 2014 2:06pm
  •  PipMeUp
  • Joined Aug 2011 | Status: Member | 1,305 Posts
Quoting saneblane
Disliked
{quote} You're the 100th poster on my thread, so today is your lucky day. Go play the lottery before your luck runs out. And on another note, Yayyyyyy My thread made 100 post didn't know there would be any interest. And on another note again, Ok, It looks good, but to be useful it would have to be consistent in the information it provides. It doesn't have to be right all the times though just about 60 percent would do. The issue is to find the best start and stop point to use, at what point does the data becomes irrelavant? that a whole other topic...
Ignored
For the sake of my curiosity I built the profile before the lowest low. The green blob was already there. Unsure I would have bought against the trend but a good zone to cover a short for a bear at that time. I think I'm going to investigate a bit more this market profile stuff.
Attached Image (click to enlarge)
Click to Enlarge

Name: AUDUSD-RG20-2.png
Size: 26 KB
No greed. No fear. Just maths.
 
 
  • Post #106
  • Quote
  • May 15, 2014 2:10pm May 15, 2014 2:10pm
  •  saneblane
  • Joined Jun 2013 | Status: Member | 475 Posts
Quoting PipMeUp
Disliked
{quote} For the sake of my curiosity I built the profile before the lowest low. The green blob was already there. Unsure I would have bought against the trend but a good zone to cover a short for a bear at that time. I think I'm going to investigate a bit more this market profile stuff. {image}
Ignored

Ok keep digging, it's interesting that's for sure.
Being a trader is lonely, but being a great trader is lonelier still
 
 
  • Post #107
  • Quote
  • May 15, 2014 7:23pm May 15, 2014 7:23pm
  •  moomooforex
  • | Joined Oct 2013 | Status: Member | 37 Posts
Quoting srmfx
Disliked
An example of order flow trading. Short-term specs were short after the post ECB sell off. Bids in the 1.3650/40 zone (http://theultimatetradingedge.com/blog/?p=1016) contained the downward price move. The daily range was higher than the ATR20. Perfect conditions for a short squeeze. The perfect time usually is after the initial reaction to major economic data. {image}
Ignored
The trade you describe looks like this with tick volume...
Attached Image (click to enlarge)
Click to Enlarge

Name: EURUSD_1.png
Size: 67 KB


...and just a couple of days earlier there was a similar downward push, except that didn't retrace.

Can you explain?
Attached Image (click to enlarge)
Click to Enlarge

Name: EURUSD2.png
Size: 72 KB
 
 
  • Post #108
  • Quote
  • May 16, 2014 1:48am May 16, 2014 1:48am
  •  srmfx
  • Joined Nov 2007 | Status: Member | 1,929 Posts
Quoting moomooforex
Disliked
{quote} The trade you describe looks like this with tick volume... {image} ...and just a couple of days earlier there was a similar downward push, except that didn't retrace. Can you explain? {image}
Ignored
Tick volume is only part of the quote reading. You need the size of the ticks and the number of consecutive ticks in one direction also.
First case that you show is during the Asian session. There is no sufficient liquidity for a short squeeze.
 
 
  • Post #109
  • Quote
  • Edited at 2:20am May 16, 2014 1:53am | Edited at 2:20am
  •  Mingary
  • Joined Mar 2011 | Status: I should be on your ignore list | 5,537 Posts
Quoting moomooforex
Disliked
{quote} The trade you describe looks like this with tick volume... {image} ...and just a couple of days earlier there was a similar downward push, except that didn't retrace. Can you explain? {image}
Ignored
That is a very, very good point. Same pattern, different result.
I wish there was a way to differentiate between "reversal" volume and "continuation" volume.
In the end it's still a guess...
 
 
  • Post #110
  • Quote
  • May 16, 2014 2:14am May 16, 2014 2:14am
  •  eurotrash
  • Joined Sep 2009 | 392 Posts
Quoting PipMeUp
Disliked
{quote} For the sake of my curiosity I built the profile before the lowest low. The green blob was already there. Unsure I would have bought against the trend but a good zone to cover a short for a bear at that time. I think I'm going to investigate a bit more this market profile stuff. {image}
Ignored
My initial reaction to the two images you posted with volume profile-style tick volume is, it looks almost the opposite of "real volume" VP. For example turning points or prices where the market bounces off then goes right through (see highest red volume in your first chart) are typically some of the lowest volume prices (because the market doesn't hang around there long enough for lots of orders to trade), but on your charts they have the highest volume. And areas where we churn and hang about typically generate a fair bit of volume, but on your charts they're very low volume areas. Maybe your charts are showing the volume as the net difference between the bid and ask trades (or up and down ticks, however tick volume works) as opposed to cumulative?
 
 
  • Post #111
  • Quote
  • Edited at 2:58am May 16, 2014 2:23am | Edited at 2:58am
  •  saneblane
  • Joined Jun 2013 | Status: Member | 475 Posts
Quoting Mingary
Disliked
{quote} That is a very, very good point. Same pattern, different result. I wish there was a way to differentiate between "reversal" volume and "continuation" volume. In the end it's still a guess...
Ignored

You just described the reason why I went to order flow trading. 2 signals can appear the same place and have the same activity and 2 completely different results that leave you scratching your head. It's like being in a boxing match with one hand behind your back. VSA is good no doubt, but it has it's short comings in forex I think, but nothing is perfect it's something we have to accept.
Being a trader is lonely, but being a great trader is lonelier still
 
 
  • Post #112
  • Quote
  • May 16, 2014 2:36am May 16, 2014 2:36am
  •  Mingary
  • Joined Mar 2011 | Status: I should be on your ignore list | 5,537 Posts
Quoting saneblane
Disliked
{quote} You just described the reason why I went to order flow trading. 2 signals can appear the same place and have the same activity and 2 completely different results that leave you scratching your head. It's like being in a boxing match with one hand behind your back. VSA is good no doubt, but it has it's short comings in forex I think, but nothing in perfect it's something we have to accept.
Ignored
VSA as it is, is just a commercial enterprise, made out to be extremely complex so that customers would feel like they are getting their money's worth.
 
 
  • Post #113
  • Quote
  • May 16, 2014 2:42am May 16, 2014 2:42am
  •  saneblane
  • Joined Jun 2013 | Status: Member | 475 Posts
Quoting Mingary
Disliked
{quote} VSA as it is, is just a commercial enterprise, made out to be extremely complicated so that customers would feel like they are getting their money's worth.
Ignored

It's true, can't argue with that.
Being a trader is lonely, but being a great trader is lonelier still
 
 
  • Post #114
  • Quote
  • May 16, 2014 2:43am May 16, 2014 2:43am
  •  moomooforex
  • | Joined Oct 2013 | Status: Member | 37 Posts
Quoting srmfx
Disliked
{quote} Tick volume is only part of the quote reading. You need the size of the ticks and the number of consecutive ticks in one direction also. First case that you show is during the Asian session. There is no sufficient liquidity for a short squeeze.
Ignored
I agree that for there to be strong momentum, there needs to be backing from the market. Asian session is the quietest and perhaps large moves in EURUSD are unsubstantiated and hence retrace. However, the times above (in UTC+10) show the market moving at the start of the London session and in the first example, retracing in the NY session.

My view on tick volumes is that we can get very limited information from tick volumes.

Higher tick volume simply indicates high volatility in the price, which probably means high liquidity. One would expect that the price would change the greatest when there are more traders driving the momentum. However, high tick volume does not indicate momentum, nor does it indicate consolidation.

It simply means there's a lot of traffic, but in what direction is anyone's guess.

This isn't much better than saying "the busiest times in the market is the overlap between London and NY sessions because that is when most traders are active." We know there will be a lot of flow in this time window compared to other time windows, we just don't know in which direction.

I have tried analyzing the number of ticks that resulted in the price going up, vs the number of ticks where the price went down, and I have tried analyzing the % price change in proportion to the number of ticks, and tried to compare today's volume vs historical average for that weekday etc etc .... but it never leads to anything reliable.

After all, in one tick the price could change 0.1 pips or 10 pips or more. Similarly, one order could be for 1 lot or 10,000 lots or more.
 
 
  • Post #115
  • Quote
  • May 16, 2014 2:55am May 16, 2014 2:55am
  •  saneblane
  • Joined Jun 2013 | Status: Member | 475 Posts
Quoting moomooforex
Disliked
{quote}I have tried analyzing the number of ticks that resulted in the price going up, vs the number of ticks where the price went down, and I have tried analyzing the % price change in proportion to the number of ticks, and tried to compare today's volume vs historical average for that weekday etc etc .... but it never leads to anything reliable. After all, in one tick the price could change 0.1 pips or 10 pips or more. Similarly, one order could be for 1 lot or 10,000 lots or more.
Ignored
That's the same thing I just posted above. But you're research is just starting before you answer that question you have to first know the weight of each currency in the market. the pip per tick ratio of a currency is always changing, and Like you I myself still haven't found a way to use it. I am wondering if the currency with the most orders being filled is normally the one with the highest tick/pip ratio. You're digging in the right spot, but it's uncharted territory you have to wing it while you go along.
Being a trader is lonely, but being a great trader is lonelier still
 
 
  • Post #116
  • Quote
  • May 16, 2014 2:56am May 16, 2014 2:56am
  •  moomooforex
  • | Joined Oct 2013 | Status: Member | 37 Posts
Here's another screenshot of EURUSD for the past 2 weeks with tick volume and sessions - Blue for Tokyo, Green for London, and Red for NY.

It's easy to see the volume is highest when the Green (London) and Red (NY) sessions overlap. However, the result can be vastly different.

Attached Image (click to enlarge)
Click to Enlarge

Name: EURUSD_3.png
Size: 61 KB
 
 
  • Post #117
  • Quote
  • Edited at 3:14am May 16, 2014 3:04am | Edited at 3:14am
  •  Mingary
  • Joined Mar 2011 | Status: I should be on your ignore list | 5,537 Posts
Quoting moomooforex
Disliked
{quote} I have tried analyzing the number of ticks that resulted in the price going up, vs the number of ticks where the price went down, and I have tried analyzing the % price change in proportion to the number of ticks, and tried to compare today's volume vs historical average for that weekday etc etc .... but it never leads to anything reliable. After all, in one tick the price could change 0.1 pips or 10 pips or more. Similarly, one order could be for 1 lot or 10,000 lots or more.
Ignored
.. so did I, any way price/volume can be cooked, I did it.
One of the thing of value that I found is the "churn".
for example: when the ticks start "spinning" on the same quote just below a trend line that can be meaningful.

high churn at 103.27

Attached Image
 
 
  • Post #118
  • Quote
  • May 16, 2014 3:24am May 16, 2014 3:24am
  •  srmfx
  • Joined Nov 2007 | Status: Member | 1,929 Posts
For the analysis of volatility I use the Average Range, but the chart is the same as for the Tick Volume.
Attached Image (click to enlarge)
Click to Enlarge

Name: q12014.png
Size: 24 KB
 
 
  • Post #119
  • Quote
  • May 16, 2014 3:59am May 16, 2014 3:59am
  •  Vitez
  • | Joined Nov 2012 | Status: Member | 547 Posts
Quoting Mingary
Disliked
{quote} I hope it's ok then... I would not want anyone getting the wrong idea about me...
Ignored
It's not ok you are the anti trader guy
 
 
  • Post #120
  • Quote
  • May 16, 2014 4:24am May 16, 2014 4:24am
  •  mikkom
  • Joined Mar 2008 | Status: Still testing and trading | 1,537 Posts
Quoting PipMeUp
Disliked
{quote} How do you estimate the inflow/outflow of the currencies? I tried to do this (http://www.forexfactory.com/showthread.php?t=435706) but the results aren't extraordinary because the lag is too big.
Ignored
You can use futures for estimating volumes to some extent or if you are looking for longer term picture (check COT report for some non-chart information *). Other than that there is no way to estimate flow as the fx is not centralized and FX is one of the only markets where it's actually quite easy (and legal) to hide your trades.

*) http://www.cftc.gov/dea/futures/financial_lf.htm
*) http://www.cftc.gov/MarketReports/Co...ders/index.htm
 
 
  • Trading Discussion
  • /
  • Order flow trading thread
  • Reply to Thread
    • 1 45Page 678 9
    • 1 5Page 67 9
0 traders viewing now
  • More
Top of Page
Forex Factory Blog Updated: Alerting All Members
  • Facebook
  • Twitter
About FF
  • Mission
  • Products
  • User Guide
  • Media Kit
  • Blog
  • Contact
FF Products
  • Forums
  • Trades
  • Calendar
  • News
  • Market
  • Brokers
  • Trade Explorer
FF Website
  • Homepage
  • Search
  • Members
  • Report a Bug
Follow FF
  • Facebook
  • Twitter

FF Sister Sites:

  • Metals Mine
  • Energy EXCH
  • Crypto Craft

Forex Factory® is a brand of Fair Economy, Inc.

Terms of Service / ©2022