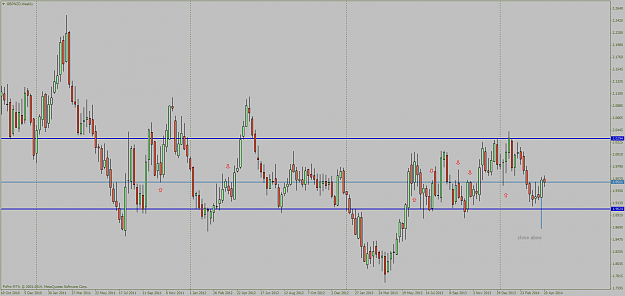
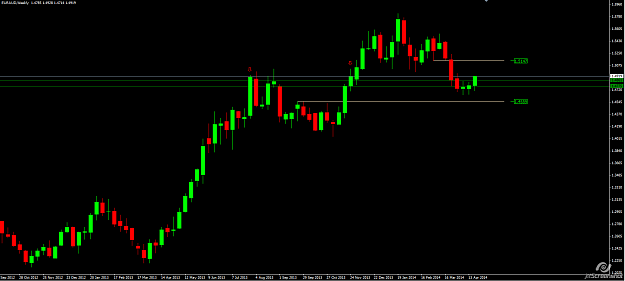
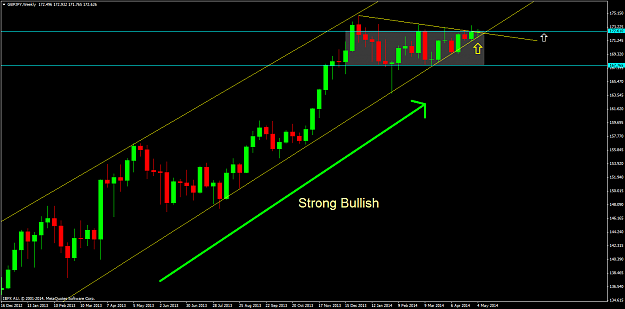
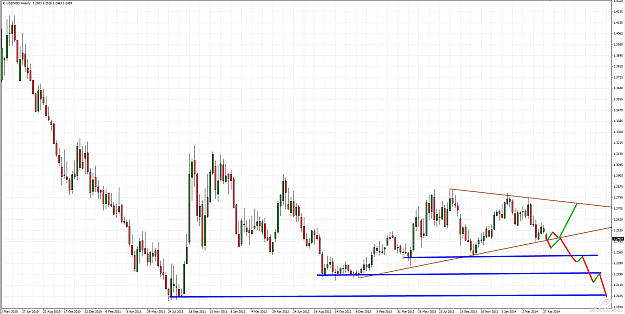
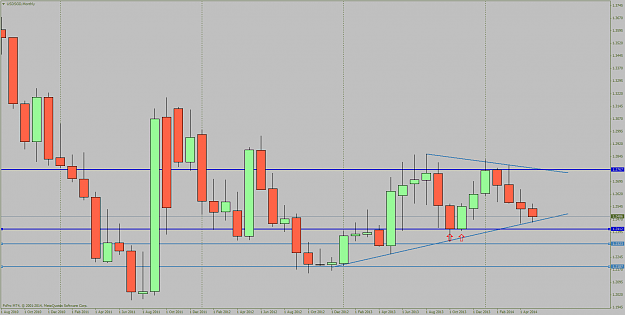
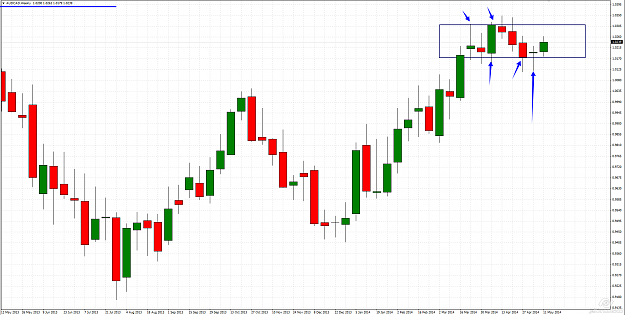
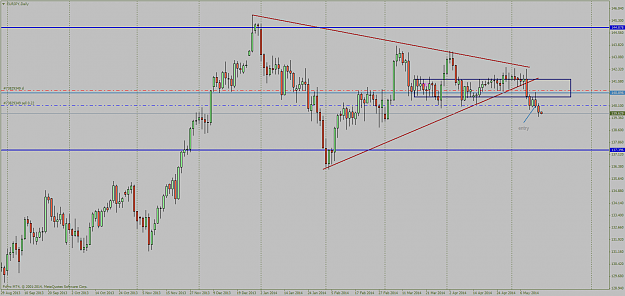
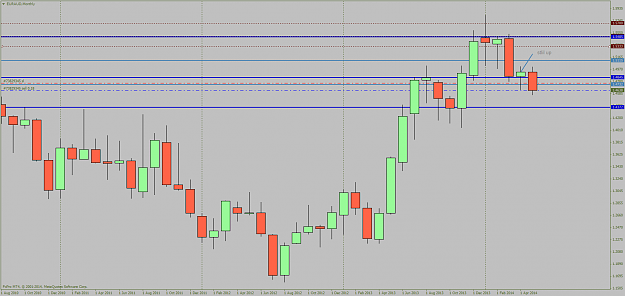
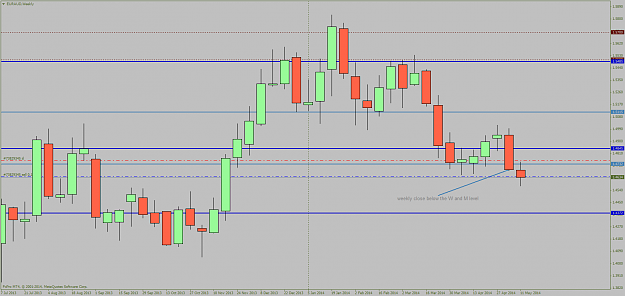
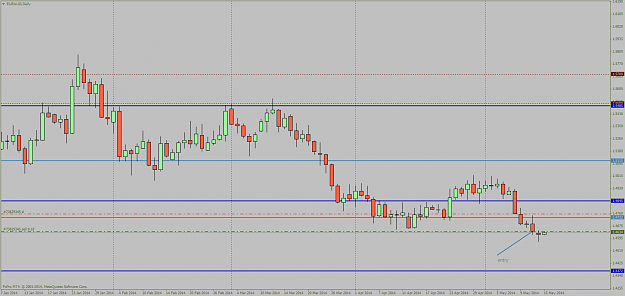
Here is another example of identifying the S/R levels on higher TF ( M ) and look how the P reacted on D chart...very simple and very predictable :
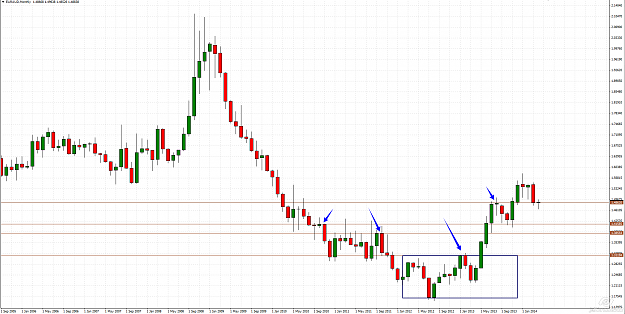
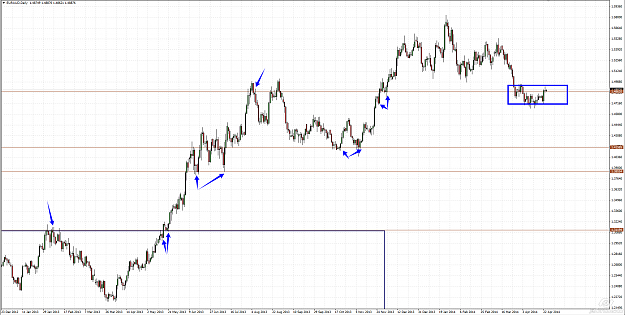
Attached Image(s) (click to enlarge)
Nothing personal,just business