I need your help finding/coding an indicator that would allow me to draw multiple horizontal lines on the chart. I'm not after an indicator that paints pivot points or S/R levels, I want something where I can add the prices myself. I want to use the futures volume data from the eVOLution website by VolumeTrader. Every day new data is released so there would need to be 5 slots (one for every day of the week) and each has to have a custom color which can be changed (easy to distinguish between days). I've been adding these horizontal lines to the chart manually, but it takes up a lot of time and when new data comes in, finding the old ones and replacing them with the new ones takes ever more time. With an indicator described above, I would just erase the levels from the inputs and paste new price data and be done with it.
The reason I want to use this is that I've found the futures volume data to be quite useful in determining price targets once price has already started moving in the direction of the liquid price area. I don't know if an indicator like this exists and I'm not a coder, but if one cannot be found, I'd be very happy to see someone code the indicator.
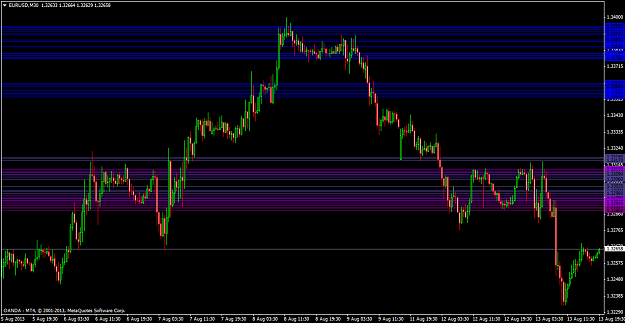
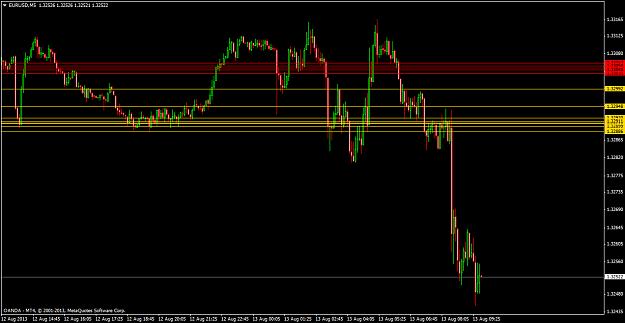
This is what it should look like on the chart
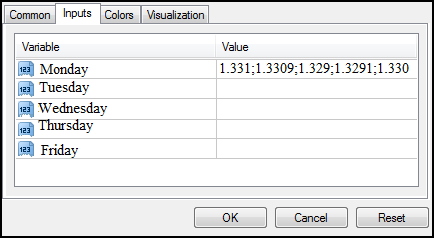
This is my idea of the inputs UI
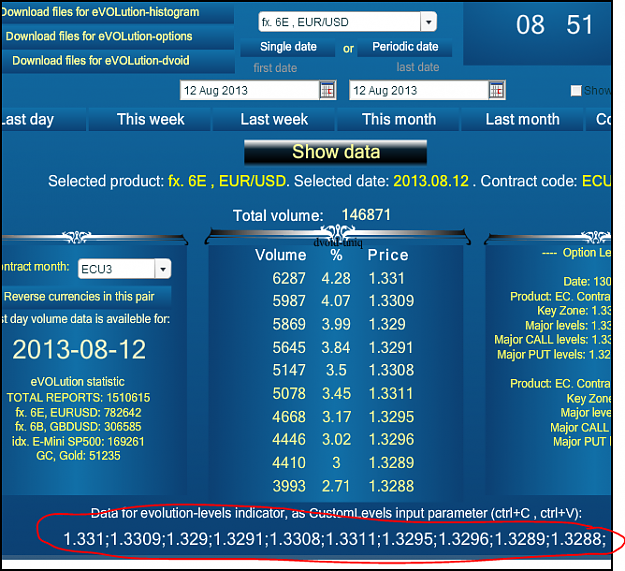
This is where I get the data from, price are separated by semicolons.
The reason I want to use this is that I've found the futures volume data to be quite useful in determining price targets once price has already started moving in the direction of the liquid price area. I don't know if an indicator like this exists and I'm not a coder, but if one cannot be found, I'd be very happy to see someone code the indicator.
This is what it should look like on the chart
Attached Image (click to enlarge)
This is my idea of the inputs UI
Attached Image
This is where I get the data from, price are separated by semicolons.
Attached Image (click to enlarge)
If you don't risk, you don't ever have to lose.