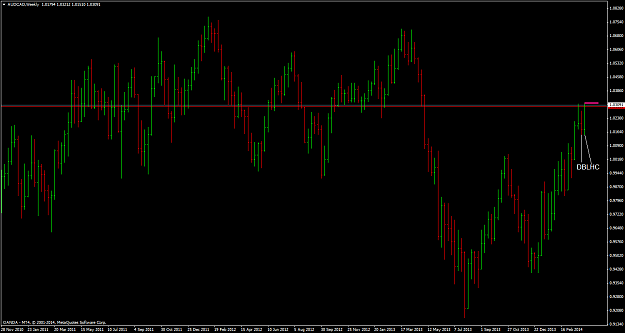
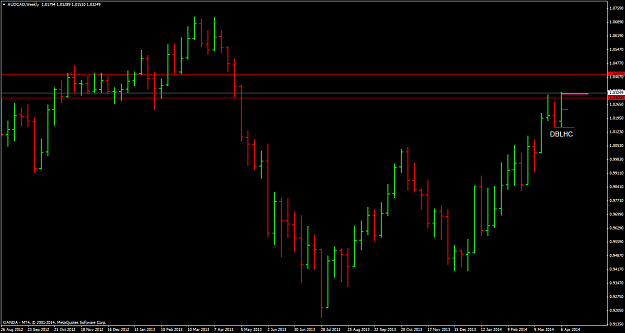
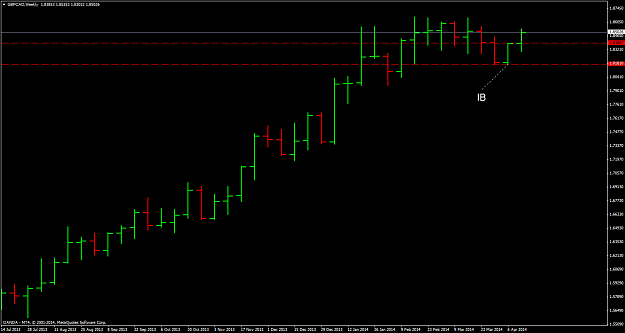
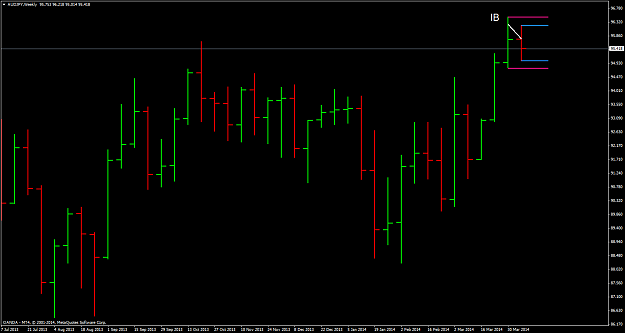
Below is live chart of a weekly IB that has formed on April 11 (Fridays’ close). I have marked the highs and lows as shown.
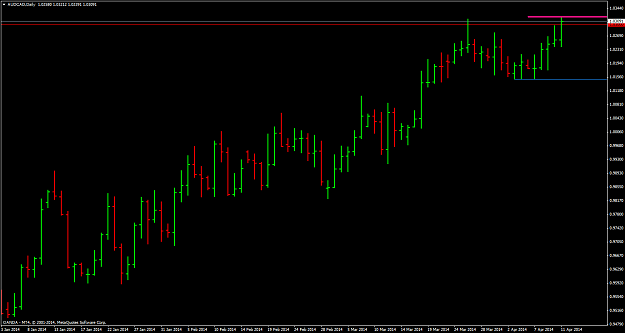
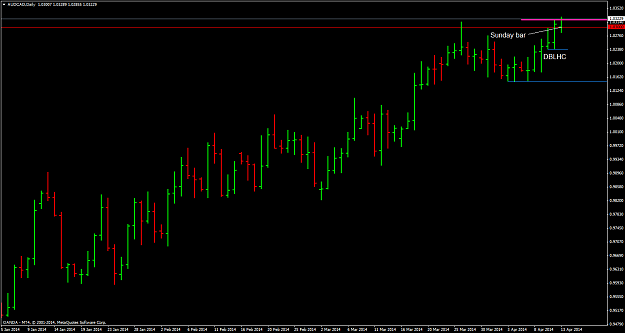
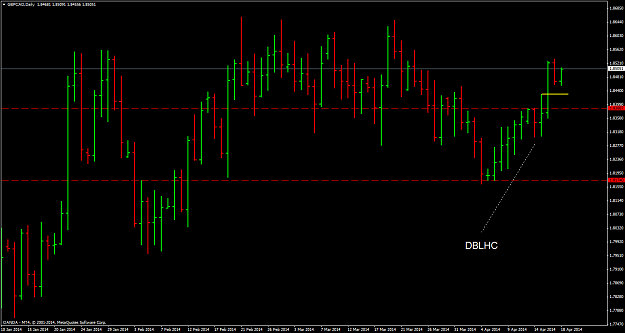
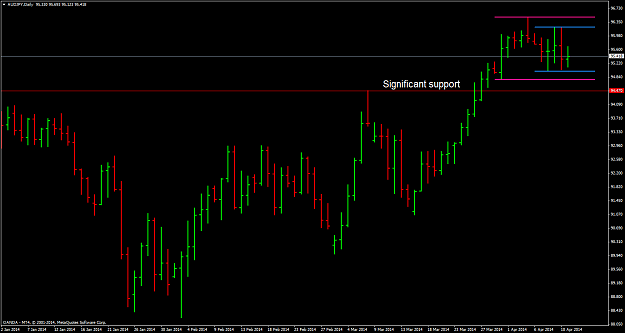
Here’s the daily view. Note the addition of the red horizontal support line. I have a long bias here and would prefer bullish PA breaking long and preferably closing above the high. I would likely ignore bearish PA breaking south and closing above the horizontal support. However if it was a large bearish PA bar closing below the red support line then I would consider selling. If price was to bounce off the red horizontal line with good bullish PA then I would consider buying. Consider that price usually doesn’t obey our perfect horizontal lines. Price waves usually retrace into the previous price wave so a break south would need to occur with strong PA to consider selling
Attached Image (click to enlarge)