A Simple System that you can Personalize:
To anyone reading this thread
This thread is not do be seen as advice on trading in anyway- it is to help give some ideas,
I take no responsibility for anyone's trading. Winning or losing.
If you trade this system, any trades you do take from info from this thread, you do it on your own responsibility.
I take NO responsibility for any trades from anyone.
IT IS IN NO WAY TO BE SEEN AS TRADE CALLS OR TRADE SIGNALS OR TRADE RECOMMENDATIONS.
I would recommend you trade on Demo account until you feel you can take trades on your own responsibility.
Do not trade with real money ever - until you can take your own responsibility for your trading.
Never trade money you cannot afford to lose as odds are you will lose your money.
85% of all traders loss all or most of their money they trade with.
So trading it is very risky BECAREFUL.
Tools or Indicators or -Oscillators to be used on this thread
Also I have seen thread after thread die on FF
Because people add this and that and in a few week it’s not the same thread
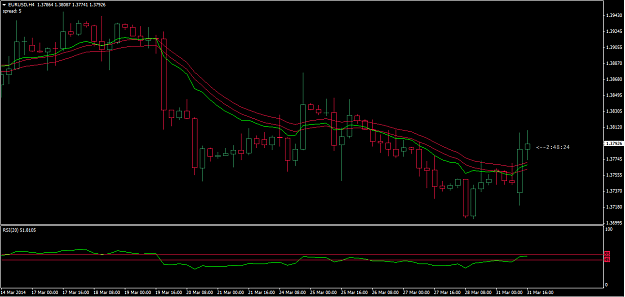
Only the follow tools can be used 5 &12 EMAs and 20 RSI on our charts
- No other tools - indicators and/or -oscillators.
SDZ, Trend Lines and Support and Resistance Levels (SDL) are ok.
And also Normal Candles- no RSI Candles or trading bars.
Let’s all do the same thing and it’s easier to see and understand
Anyone posting anything else will be banned - it’s the only way
For the 20 RSI - Template - Please read post 8, 10, 11 & 160
Tools:
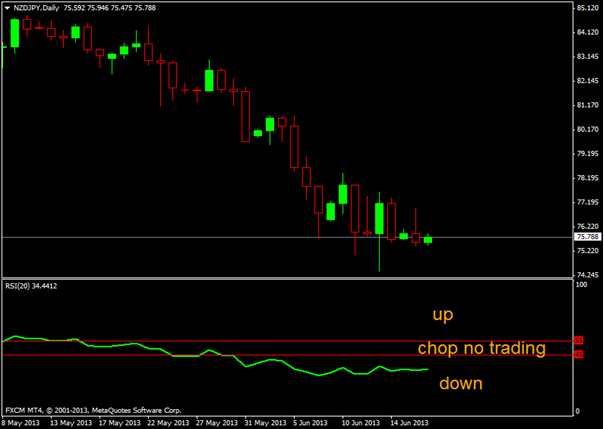
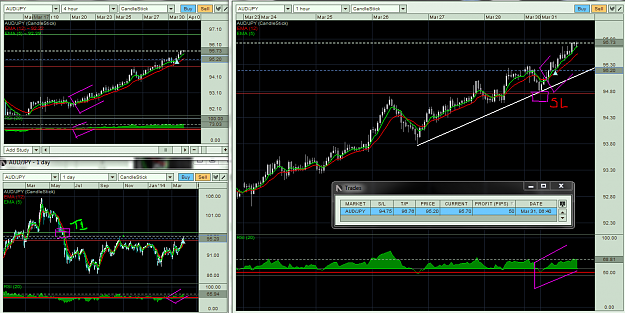
20 RSI with 45, 50 and 55 levels shown - I normally put a red line at the 50 level
EMAs - 5 and 12 closed
Standard Candles - Momentum Candles (MC)
Supply and Demand Zones (SDZ) Round Numbers (RN)
Time Frames:
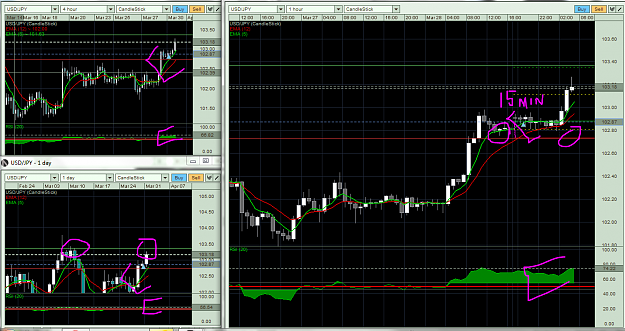
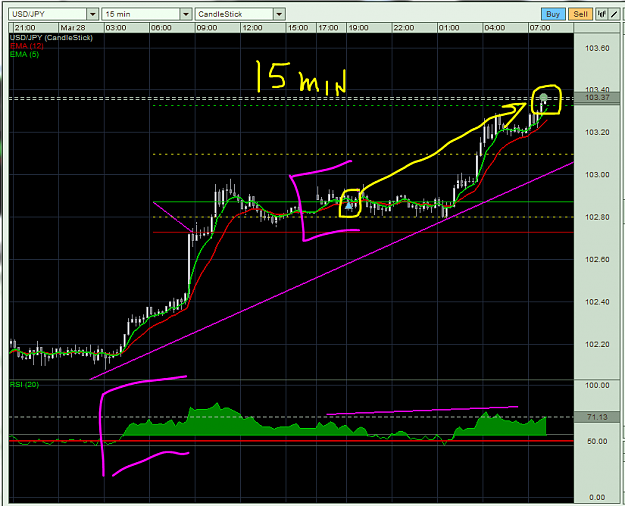
Main Time Frame is the one hour - In a real strong trend I drill move down to 15 minutes chart.
But only if I miss the trade on the hour - This is still really an hour trade
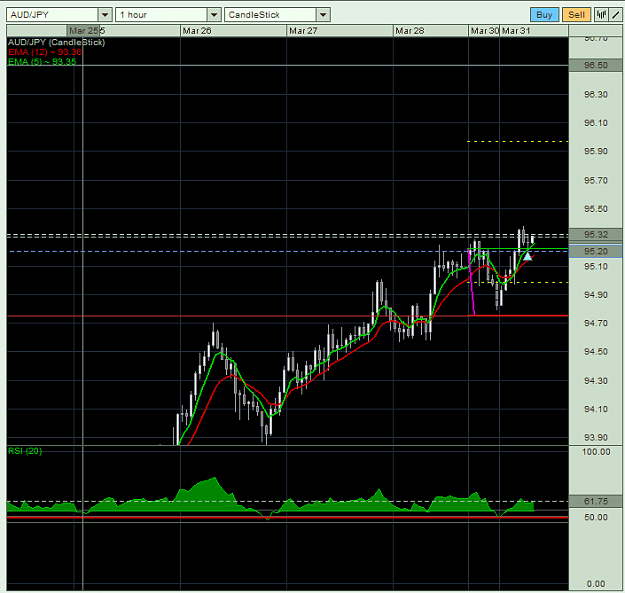
Look for a good stop on Hour or the 15 Minutes Charts
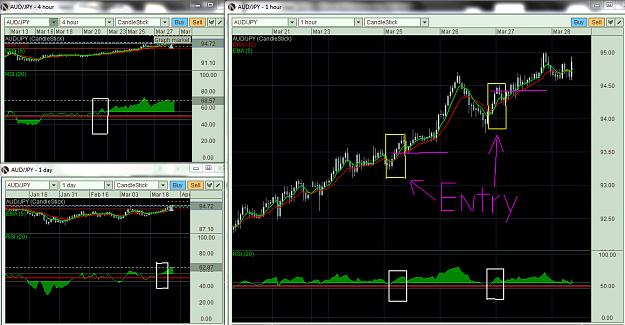
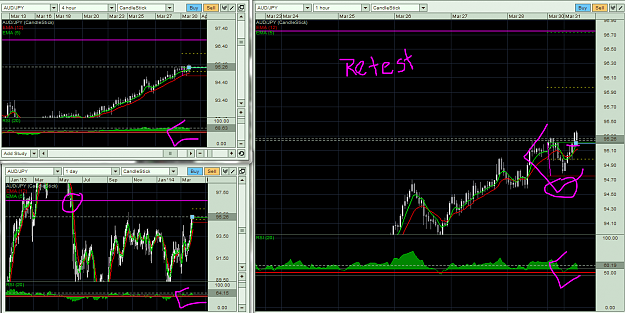
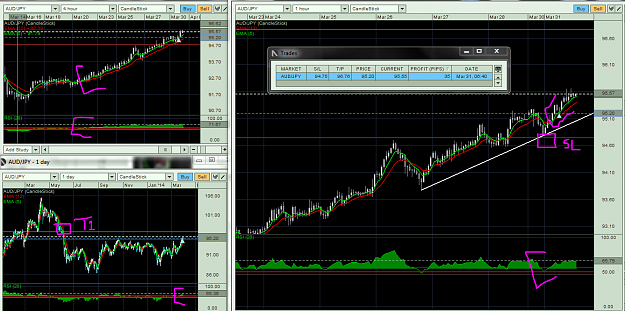
Must be a strong trend on the cover chart(s) - The Four hour & Day show this with the 20 RSI on those time frame.
Look for Targets on the 4 Hour &/or Day Charts. (Sometimes weekly)
Trading Chart - One Hour
Trend and Target Charts - Four Hour and Day (Sometimes Weekly)
Trigger charts - 15 Minutes (and Hour)
The Secrets:
1. Is to get a good Reward to Risk Ratio (RRR)
2. To do this you have to have great - S.E.T. Rules: (Stop Loss & Entry & Target)
3. Its a great Trend & Retracement System - not a Tops & Bottoms System. You want to get the sweet spot in a trend.
Entry: for a buy : (reverse for a sell)
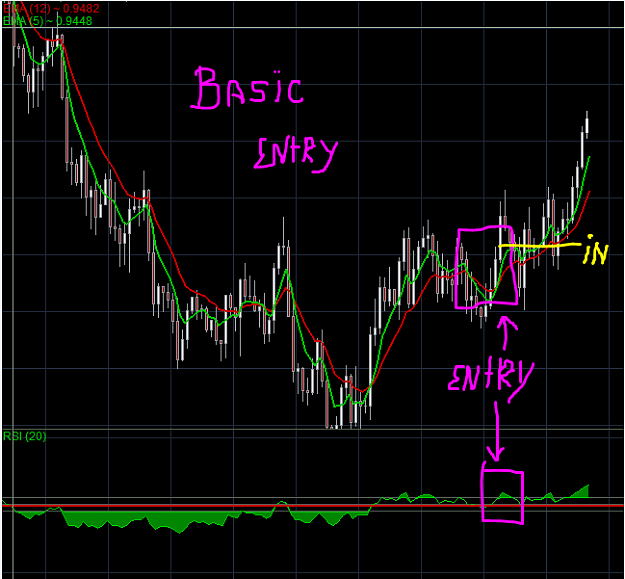
1. 5 EMA breaks over 12 EMA - (Retracement)
2. Price breaks over or is over the 55 Level on the 20 RSI (Trend)
3. Trade is in line with Big Trend on the Four hour & Day use the 20 RSI on these charts (Big Picture)
4. A good Target and good Stop Loss- so a good Risk to Reward Ratio (RRR)
5. A Candle Entry that is simple to see and understand (Entry)
