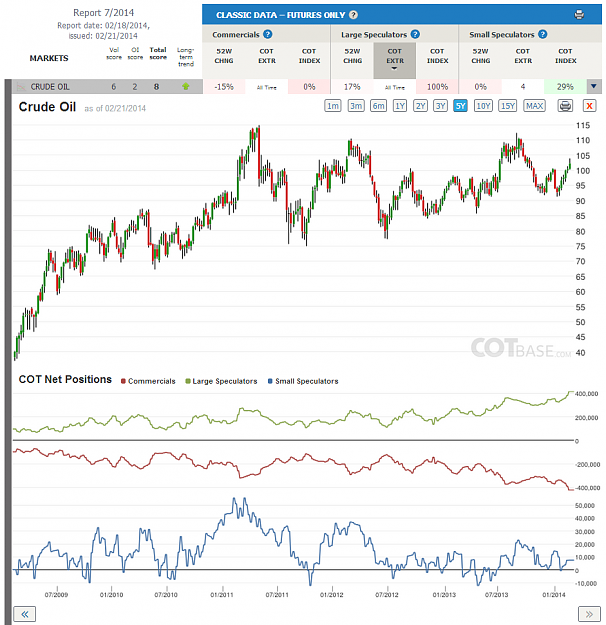
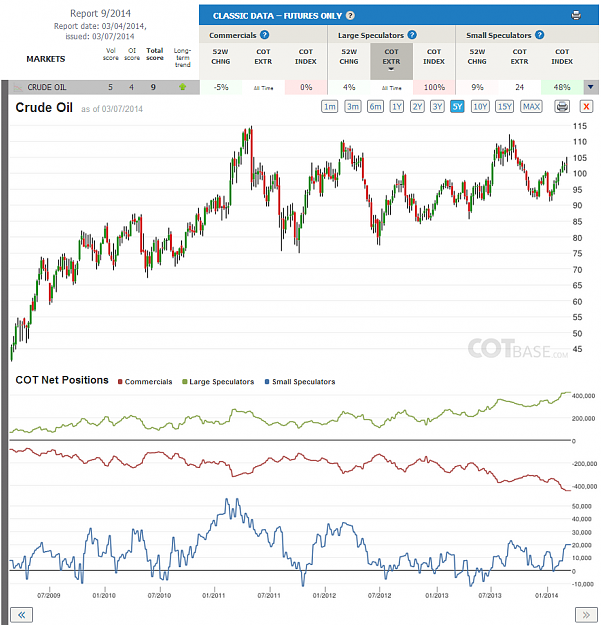
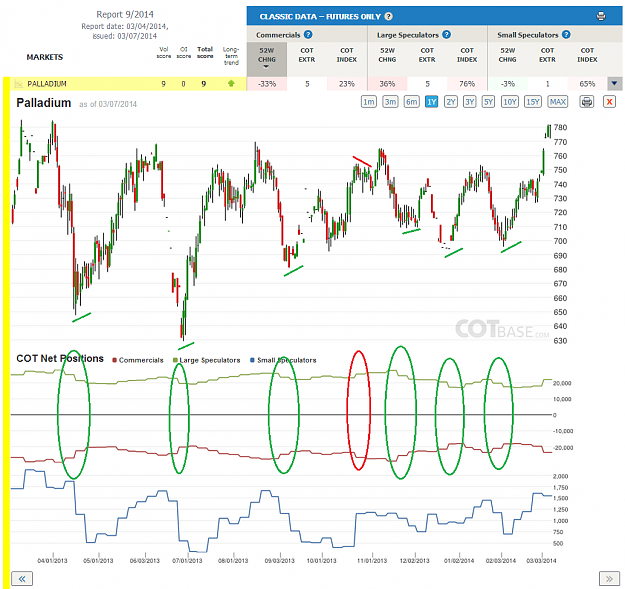
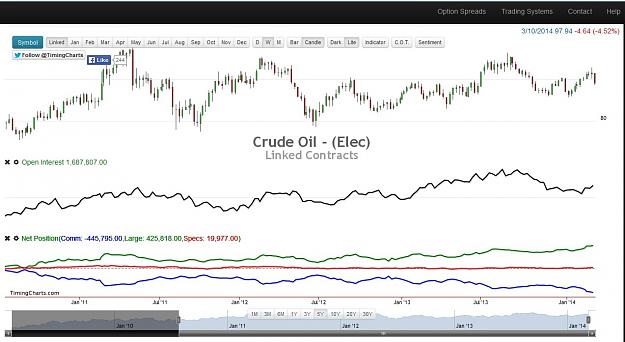
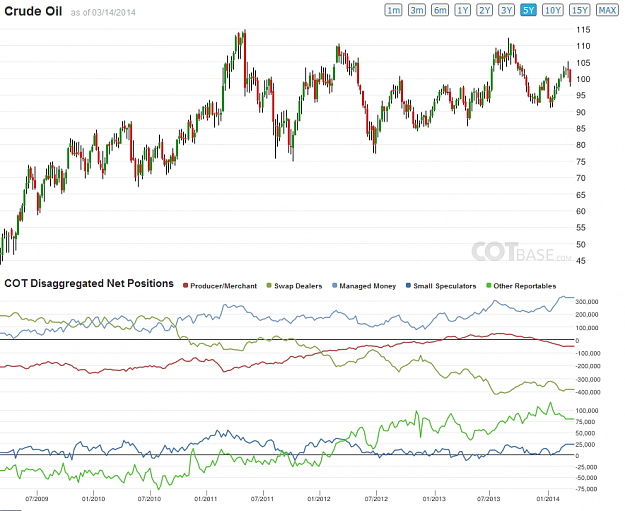
• Home
  • Forums
  • Trades
  • News
  • Calendar
  • Market
  • Brokers
  • Login
  • Join
  • User/Email: Password:
  • 2:43am
Menu
  • Forums
  • Trades
  • News
  • Calendar
  • Market
  • Brokers
  • Login
  • Join
  • 2:43am
Sister Sites
  • Metals Mine
  • Energy EXCH
  • Crypto Craft

Options

Bookmark Thread

First Page First Unread Last Page Last Post

Print Thread

Similar Threads

Forex smart money concepts 81 replies

Price Action & Fundamentals with Smart Money 79 replies

Discussion about Smart Money 1 reply

Trading Smart Money 2 replies

  • Commercial Content
  • /
  • Reply to Thread
  • Subscribe
  • 1,013
Attachments: Follow the Smart Money / COT Analysis
Exit Attachments
Tags: Follow the Smart Money / COT Analysis
Cancel

Follow the Smart Money / COT Analysis

  • Last Post
  •  
  • 1 1213Page 141516 42
  • 1 13Page 1415 42
  •  
  • Post #261
  • Quote
  • Feb 23, 2014 6:36am Feb 23, 2014 6:36am
  •  Wolf_Wicked
  • | Additional Username | Joined Oct 2013 | 894 Posts
Quoting numbnuts
Disliked
{quote} Thanks man, I'm hopeless with shit like this I'm not really waiting for any more fundamental events - I think everything that needs to happen has happened, commercial sentiment is already incredibly bearish and I'm just waiting for PA now. There could be a fundamental trigger - increased production/political stability from Iran, Nigeria or Venezuela - or Japan deciding to bring its nuclear reactors back online - but I don't think there needs to be a reason. COT shows that the "big boys" have already found all the reasons they need.
Ignored
On your keyboard you should have a "pnt scrn" button? If you hit that whatever you're looking at on your computer should be copied to the "clipboard"... Then you can just paste it wherever

Don't worry it's the mark of a real trader who doesn't know these things

Doug... I get all the indicies and commodities through FXCM...Not that I trade them too much but I know GFT offer them also through particular accounts. That's all I got for ya
Howlin' at the Moon on the Roof
 
 
  • Post #262
  • Quote
  • Feb 24, 2014 4:47am Feb 24, 2014 4:47am
  •  Pipanator
  • | Joined Jun 2011 | Status: Keep It Simply Stupid | 356 Posts
my last post on this thread after 2.5 years of market observation I have concluded due to my experience that the market is not manipulated, but follow patterns and cycles exactly the same as blood flow, growth of a flower and spiral galaxies. It's a myth that banks control the market. They do however trade against each other, but it has no relevance to the retail trader.
Find your Favourite Pattern
 
 
  • Post #263
  • Quote
  • Feb 24, 2014 5:24am Feb 24, 2014 5:24am
  •  Dunstan
  • | Commercial Member | Joined Jul 2012 | 444 Posts
Quoting numbnuts
Disliked
Hi Dunstan I'm also subscribed to COTbase but can't seem to post charts here - how are you doing it? The pressure on crude is getting ridiculous - I wonder what fundamentals cued the commercials to get so short? Maybe the growth of Tesla Autos and the electric car? The reduction of trade sanctions against Iran? Just waiting for price action to align with sentiment and I'm in .... I think this could be the trade of the year.....
Ignored
Hi numbnuts,

I see others have already answered you, sorry for not being fast enough
I actually use Microsoft OneNote, cause it’s a fast way to capture images on your screen. If you’ve got Office on your computer, it should be part of it.

Crude Oil: I agree, stress levels are HUGE, the picture is very bearish. Only one important remark: cot all time extreme can exist for many weeks, before the “burst” , before prices react. It’s definitely good, if you area monitoring closely this great market!

All the best,
Dunstan
 
 
  • Post #264
  • Quote
  • Feb 24, 2014 5:27am Feb 24, 2014 5:27am
  •  Dunstan
  • | Commercial Member | Joined Jul 2012 | 444 Posts
Quoting M.A.C.Doug
Disliked
What brokers are you guys using to trade all these instruments?
Ignored
Hi M.A.C. Doug,

I’m at Interactive Brokers.

All the best,
Dunstan
 
 
  • Post #265
  • Quote
  • Feb 24, 2014 5:53am Feb 24, 2014 5:53am
  •  Dunstan
  • | Commercial Member | Joined Jul 2012 | 444 Posts
Hi everyone,

The latest Commitments of Traders review is out.

Soybean Oil
COT Change (52W) / C – 36%, LS – 40% /
Technically, we are close to an important resistance level, so the large cot change may capable of stopping the rally, BUT (!) let’s not forget that in the medium, longer term cot extreme signals are the real “price movers”. You may see that about a month ago (basically when we’ve reach the bottom), we were close to an all-time cot extreme. If prices are able to continue their rise (judging by the dynamics of price in the last few weeks, I think they’re able to) and we see Large Speculators becoming net long once again, then I think we can be pretty sure that the trend is once again pointing upwards.

Crude Oil
COT Extreme / C, LS – All Time COT extreme /
I can only repeat myself: the extreme is “All Time” large, so we are expecting prices to decline. Important remark: cot all time extreme can exist for many weeks, before price reaction.


Coffee
COT Change (52W) / C – 16%, LS – 17% /
COT Extreme / C – 145 report, LS – 144 report COT extreme /
Enjoy the ride --> for all of you, who reacted on the bullish cot extreme signal that we had in the end of last year. You may ask: Ok, great, but how long could this ride last? If we look at the historical charts, tops developed when Commercials were holding more than 40.000 contracts net short (LS, roughly the opposite / this is true since about 2004). Because of the dynamics both in price and in the cot report, I think that we may reach even >60.000 contracts before the rally is exhausted.

All the best,
Dunstan

the original COT report


COT charts
Attached Image(s) (click to enlarge)
Click to Enlarge

Name: Report7_Coffee.png
Size: 210 KB
Click to Enlarge

Name: Report7_Crude Oil.png
Size: 227 KB
Click to Enlarge

Name: Report7_Soybean Oil.png
Size: 264 KB
 
 
  • Post #266
  • Quote
  • Edited Feb 25, 2014 12:19am Feb 24, 2014 10:26pm | Edited Feb 25, 2014 12:19am
  •  Ck87
  • | Commercial Member | Joined Oct 2012 | 3,968 Posts
Quoting Dunstan
Disliked
Hi everyone, The latest Commitments of Traders review is out. Soybean Oil COT Change (52W) / C – 36%, LS – 40% / Technically, we are close to an important resistance level, so the large cot change may capable of stopping the rally, BUT (!) let’s not forget that in the medium, longer term cot extreme signals are the real “price movers”. You may see that about a month ago (basically when we’ve reach the bottom), we were close to an all-time cot extreme. If prices are able to continue their rise (judging by...
Ignored

Dunstan, with crude oil, we see that the large specs have participated in the trend as usual and were right on that. Clearly the bearishness by the commercials is at an all time extreme, and that's the best type of signal we can get from this right? But there's also a chance that the trend continues of course.

I'm new to the COT report, but i know the fundamentals support lower prices for crude oil looking out 3+ years from now. I wonder what the commercials bearishness looked like when Crude was at $150, are they more bearish now than they were then? Let me know what you think overall about crude here. I'm certainly planning on going big on that short because it's a long term trend that I'm counting on that hasn't really taken off yet, while most other trends have already took off. With exception to maybe Sugar that's going to go up big long term as well..

Let me know, thanks.

Also, is it a cause for concern that the small specs aren't as long as they've been in other recent rallies? Like we see the recent rallies had small specs at 20k+ 40k+ 50k+ contracts, yet this one not even above 10k.... hmm.
 
 
  • Post #267
  • Quote
  • Feb 25, 2014 10:43am Feb 25, 2014 10:43am
  •  Dunstan
  • | Commercial Member | Joined Jul 2012 | 444 Posts
Hi Ck87,

Quoting Ck87
Disliked
{quote} Dunstan, with crude oil, we see that the large specs have participated in the trend as usual and were right on that. Clearly the bearishness by the commercials is at an all time extreme, and that's the best type of signal we can get from this right? But there's also a chance that the trend continues of course.
Ignored


Both of your statements are correct:

The best cot extreme signals, are the All Time extremes, but as I’ve mentioned earlier, they can be present in a market for quite some time, before we see prices react.

The trend may continue upwards, although the extreme does suggest that prices should fall. There are rare occasions, when these cot extremes fail to effect prices, they are called “Commercial Capitulation” (you can read more about it post#42 in this thread), but I don’t think it has ever happened in Crude Oil.

Quoting Ck87
Disliked
{quote} I wonder what the commercials bearishness looked like when Crude was at $150, are they more bearish now than they were then? Let me know what you think overall about crude here.
Ignored


I have attached a chart for you, showing the full history of the cot report on Crude Oil. I’ve indicated the All Time extreme that we had then. LS and C are definitely more extreme now than they were then. This should not be emphasized too much though, it’s the normal behavior of markets --> Traders are capable of building up larger positions then before…

What I think about Crude Oil? Before I answer, I have to tell you, that in my experience, cot signal’s effectiveness is different in the different market categories (and of course market by market). I think they can be used with the most efficiency in grains and least in indexes. Energies are somewhere in between, but closer to grains.

CL: I think there is a higher chance now that prices will fall then there is for a significant (further) rally. Of course there are two main questions left: when to enter / what’s the reward potential --> As I’ve said earlier, the extreme is capable of widening even more, before prices reach a top, thus I might wait with a better entry = to minimize risk --> finding an important resistance level, where I can place a comfortable stop. Regarding the reward potential, we should again examine the past… we can see that prices were able to decline roughly 20-50% after a major shift in the trend. It’s difficult to tell exactly to what depth prices can fall, but I think it’s reasonable to expect at least a 20% drop, which isn’t that bad, if you are able to enter well.

Quoting Ck87
Disliked
{quote} Also, is it a cause for concern that the small specs aren't as long as they've been in other recent rallies? Like we see the recent rallies had small specs at 20k+ 40k+ 50k+ contracts, yet this one not even above 10k.... hmm.
Ignored


It’s not that big of a concern in my opinion, but you are right --> it would be a much clearer cot sell signal if they were holding >40.000 contacts net long.

All the best,
Dunstan
Attached Image (click to enlarge)
Click to Enlarge

Name: Report7_Crude Oil_Max.png
Size: 214 KB
 
 
  • Post #268
  • Quote
  • Mar 3, 2014 5:00am Mar 3, 2014 5:00am
  •  Dunstan
  • | Commercial Member | Joined Jul 2012 | 444 Posts
Hi everyone,

The latest Commitments of Traders review is out.

Nasdaq-100
COT Change (52W) / C – 32%, LS – 32% /

COT Index (3 yr) / C – 1%, LS – 90%, SS – 70% /
The large change in Traders positions is a bearish cot signal that could affect prices in the near term. Not only do we have this larger change, but also a cot extreme that indicates an end for the rally. Of course we should see that for the past 1-1,5 years we have reached these extreme levels multiple times without any major price reaction. I wouldn’t be surprised at all if this extreme could become even much greater when we eventually reach a top.

Coffee
COT Extreme / C – 146 report, LS – 146 report COT extreme /
Nothing special here, the extreme is becoming larger and larger as prices are rising. As I’ve said last week, we should expect a change in the trend once Commercials and Large Speculators reach their bearish all time cot extremes.


Wheat (Minn.)
COT Extreme / C – 111 report, LS – 96 report COT extreme /
Although we’ve reached a cot extreme worth mentioning, on the 5 year chart we can see that there is still space left for the extreme to widen. This relative cot extreme examined in context with traditional TA tools (clearly visible downwards channel) may paint a more bearish picture: so I’m not saying that we need to wait for a much greater cot extreme to see prices decline, the extreme is already large enough that we can think about a short trade.


All the best,
Dunstan

the original COT report


COT charts
Attached Image(s) (click to enlarge)
Click to Enlarge

Name: Report8_Wheat.png
Size: 233 KB
Click to Enlarge

Name: Report8_Coffee.png
Size: 236 KB
Click to Enlarge

Name: Report8_Nasdaq-100.png
Size: 240 KB
 
 
  • Post #269
  • Quote
  • Mar 10, 2014 6:03am Mar 10, 2014 6:03am
  •  Dunstan
  • | Commercial Member | Joined Jul 2012 | 444 Posts
Hi everyone,

The latest Commitments of Traders review is out.

Palladium
COT Change (52W) / C – 33%, LS – 36% /
Looking closer at the chart, we can see that the cot change signals in Palladium were pretty effective. Interestingly, there were more bullish change signals then bearish ones… The change we have now says that prices will fall. If we look at a longer chart, we can see that we have moved away from the bearish cot extreme that was present in the market in 2013. We can of course get there again, but for now, it seems that the extreme is not that large yet to really

end to the rally in Palladium.

Russel-2000
COT Change (52W) / C – 31%, LS – 28%, SS – 30% /
Similarly to Palladium, we can state that cot change signals in Russel-2000 are usable signals. Luckily we’ve got a bit more example for the bearish ones. The cot change signal we’ve got now is a stronger one suggesting a decline in prices. The cot extreme could be larger and if so, it would be a much easier task to decide what to do… If we choose to give it a chance, I’d strongly recommend it with a smaller position size or tighter stops.

Crude Oil
COT Extreme / C, LS – All Time COT extreme /
Last week we have seen some signals that indicate: we may have reached a top… The all time extreme became even greater than before --> stress levels are HUGE in CL.


All the best,
Dunstan

the original COT report

COT charts
Attached Image(s) (click to enlarge)
Click to Enlarge

Name: Report9_Crude Oil.png
Size: 227 KB
Click to Enlarge

Name: Report9_Russel-2000.png
Size: 188 KB
Click to Enlarge

Name: Report9_Palladium.png
Size: 196 KB
 
 
  • Post #270
  • Quote
  • Mar 13, 2014 10:45pm Mar 13, 2014 10:45pm
  •  wongpasar
  • | Joined Jan 2014 | Status: Member | 27 Posts
hi master dunstan

im glad.. to see someone so committed to COT analysis all this time.. as to gauge market sentiment..

no doubt.. im your fans

i've studying COT just recently..
im using different charts than your.. im using timingcharts.. it's free..

thanks to you.. i've got some hint to use COT chart with right time frames..

here some chart :

as we can see in both pic of gbp or crude oil.. in my opinion.. OI could indicated signal of early reversal or continuation for next week.. but i cant seem to get.. some time OI rise.. price upward for next week.. in another time.. OI rise but price downward for next week.. -_-'

this could lead to disaster.. master.. -_-'

what do you think about this??
Attached Image(s) (click to enlarge)
Click to Enlarge

Name: crude oil cot-OI.jpg
Size: 176 KB
Click to Enlarge

Name: gbp cot-OI.jpg
Size: 179 KB
 
 
  • Post #271
  • Quote
  • Mar 14, 2014 9:36am Mar 14, 2014 9:36am
  •  Dunstan
  • | Commercial Member | Joined Jul 2012 | 444 Posts
Hi wongpasar,

First of all thank you for your compliments, I’m glad that you are enjoying the thread!

If I’m right, you are interested generally about the correlation between OI and price?
Excluding the times of contract rollovers, generally I think that rising OI and rising prices together can be considered a bullish signal. If OI increases during declines, well that would be more of a bearish signal. Ok, what about rising/declining prices during decreasing OI? You wouldn’t believe it --> just the opposite!

Obviously it is not that easy to draw precise conclusions purely from changes in the OI and that is exactly why cot data is so crucial… it breaks down the open interest amongst major market participants, giving you a more detailed picture about the situation.

All the best,
Dunstan
 
 
  • Post #272
  • Quote
  • Mar 15, 2014 8:12am Mar 15, 2014 8:12am
  •  numbnuts
  • Joined Jan 2010 | Status: overcaffeinated.... | 1,539 Posts
Quoting Dunstan
Disliked
examine the past… we can see that prices were able to decline roughly 20-50% after a major shift in the trend. It’s difficult to tell exactly to what depth prices can fall, but I think it’s reasonable to expect at least a 20% drop,
Ignored
A word of warning here - when we look at "commercials" in crude being at extreme short positioning, it isn't really producers/merchants, as the name implies. The aggregated data lumps commercial hedgers (the smart money) in with swap dealers. When we look at disaggregated data, it shows that the smart money has actually offloaded its short positions to the swap dealers, it is they who skew the aggregated commercial position south.

Another thing - COTbase simply shows that shorts simply outnumber longs by ~400k, it doesn't relate that to depth of market. If the market was 500,000 contracts deep, that would be a much stronger signal of overextension than if the market was 2 million contracts deep.

The raw data from CFTC's website shows:

Shorts - 974,801
Longs - 544,030

Which means only 64% of commercial interests are short, but the aggregated chart showing all time extreme net positioning of 430k short implies that the ratio is much higher.

This doesn't change the signal - which is still very bearish - but you should be careful when estimating how far down price can move on this signal. Swap dealers can cover shorts faster than producers/merchants, they aren't quite as "smart", and a bias of 64% can erode quickly.
Attached Image(s) (click to enlarge)
Click to Enlarge

Name: cotraw1503.png
Size: 16 KB
Click to Enlarge

Name: Image2.png
Size: 99 KB
si hoc legere scis nimium eruditionis habes
 
 
  • Post #273
  • Quote
  • Mar 17, 2014 4:34am Mar 17, 2014 4:34am
  •  Dunstan
  • | Commercial Member | Joined Jul 2012 | 444 Posts
Quoting numbnuts
Disliked
{quote} A word of warning here - when we look at "commercials" in crude being at extreme short positioning, it isn't really producers/merchants, as the name implies. The aggregated data lumps commercial hedgers (the smart money) in with swap dealers. When we look at disaggregated data, it shows that the smart money has actually offloaded its short positions to the swap dealers, it is they who skew the aggregated commercial position south. Another thing - COTbase simply shows that shorts simply outnumber longs by......
Ignored
Hi numbnuts,

Thanks for sharing your view! I’m excited to have someone following the thread, who is analyzing the disaggregated cot reports also and not only the legacy (classic) cot reports like myself!

When judging the possible depth of decline, I simply looked at similar market situations in the past and estimated a range of possible decline. I agree with you though that it is not that easy, but it’s definitely a possible starting point when looking at the potential Risk/Reward of a trade…

Your theory about comparing the net positions to total open interest is meaningful, interesting. To be honest, I’ve never looked at this way, but it seems reasonable.

As I see it, in the disaggregated cot report, the strongest correlation between extremes and changes in the market trend can be found in Managed Money and in Swap Dealers (but please correct me, if I’m wrong). This more detailed cot report type simply confuses me, so for now, I think I’ll stick to the classical approach and look no deeper than the legacy cot reports

Please stay with us on this thread and share with us your views next time as well! I would be very happy to learn more about disaggregated cot report analysis!

Thanks again for your post!

All the best,
Dunstan
 
 
  • Post #274
  • Quote
  • Mar 17, 2014 5:05am Mar 17, 2014 5:05am
  •  Dunstan
  • | Commercial Member | Joined Jul 2012 | 444 Posts
Hi everyone,

The latest Commitments of Traders review is out.

Soybean Oil
COT Change (52W) / C – 29%, LS – 27%, SS - 37% /

COT Index (3 yr.) / C – 25%, LS – 73%, SS - 72% /
The change was very large and we also have a relatively large cot extreme – both of these bearish signals. An unquestionable bearish cot extreme signal would be the case if commercials were below 100.000 contracts net short / large specs above 80.000 contracts net long, but I believe that this extreme may already be strong enough to influence prices.

Wheat
COT Change (52W) / C – 22%, LS – 19%, SS – 19% /

COT Index (3 yr.) / SS - 100% /
Similarly to Soybean Oil, the cot change and cot extreme signals are bearish. What we can see here is that small speculators are relatively the most optimistic (cot index on a 3 years lookback period). On the other hand, if we look at the rally in 2010 and the one in 2012 (both of them starting after a bullish cot extreme – similar to the one that started the recent rally), and how traders moved their positions, I believe that there could be fuel left in the rally.

Coffee
COT Extreme / C – 159, LS – 159 report COT extreme /
There’s not much I could say here, since the picture is pretty clear: after the bullish cot extreme of last year, prices have finally lifted off and are in a strong rally. The bearish cot extreme is becoming larger very fast which warns us to be careful about further buying… I’m not saying that the rally is over, there’s still much space left for the extreme to become larger, but we should look carefully at the developments in coffee and know when to get off the roller-coaster.

All the best,
Dunstan

the original COT report


COT charts
Attached Image(s) (click to enlarge)
Click to Enlarge

Name: Report10_Coffee.png
Size: 238 KB
Click to Enlarge

Name: Report10_Wheat.png
Size: 271 KB
Click to Enlarge

Name: Report10_Soybean Oil.png
Size: 265 KB
 
 
  • Post #275
  • Quote
  • Mar 20, 2014 7:13pm Mar 20, 2014 7:13pm
  •  ProsteJa
  • | Commercial Member | Joined Jan 2012 | 388 Posts
Cool thread guys! Is there some most important posts to read? I use COT as well but I follow only commercials activity. I will read your posts and then join you in posting analysis. Good job.
Lose small, win BIG
 
 
  • Post #276
  • Quote
  • Mar 22, 2014 6:28am Mar 22, 2014 6:28am
  •  Connected
  • | Membership Revoked | Joined Mar 2012 | 860 Posts
Became immediately interested in the COT report after Ransqwauks news read CFTC says net EUR long position USD 9.2bln, increased by 46%

Would love to hear feedback on the current EURUSD COT report please.
Attached Image (click to enlarge)
Click to Enlarge

Name: cot-euro.jpg
Size: 105 KB
Tracking the Specialists.
 
 
  • Post #277
  • Quote
  • Mar 22, 2014 6:57am Mar 22, 2014 6:57am
  •  Naokia980
  • | Joined May 2013 | Status: Never Settle! | 348 Posts
Quoting Connected
Disliked
Became immediately interested in the COT report after Ransqwauks news read CFTC says net EUR long position USD 9.2bln, increased by 46% Would love to hear feedback on the current EURUSD COT report please. {image}
Ignored
Is this release published after Fomc statement? I say, because,netusd position decreased 93%?! How? What do you think?
 
 
  • Post #278
  • Quote
  • Mar 22, 2014 2:19pm Mar 22, 2014 2:19pm
  •  Connected
  • | Membership Revoked | Joined Mar 2012 | 860 Posts
Quoting Naokia980
Disliked
{quote} Is this release published after Fomc statement? I say, because,netusd position decreased 93%?! How? What do you think?
Ignored
Hi there, as far as I am aware the COT information was published yesterday Friday 21st after the FOMC statement and the data on the COT is complete up until Tuesday 18th March. The COT data is released on a Friday with the latest data of that Tuesday.
Tracking the Specialists.
 
 
  • Post #279
  • Quote
  • Mar 24, 2014 6:21am Mar 24, 2014 6:21am
  •  Dunstan
  • | Commercial Member | Joined Jul 2012 | 444 Posts
Quoting ProsteJa
Disliked
Cool thread guys! Is there some most important posts to read? I use COT as well but I follow only commercials activity. I will read your posts and then join you in posting analysis. Good job.
Ignored
Hi ProsteJa,

I’m glad you joined the thread, thanks for the kind words
I think it is important to be aware of all major players of the market, not only one. Generally speaking, Large Speculators are great in determining the main trend (see # Post 15), while Small Speculators extremes are great signals too (when they are too optimistic or pessimistic about a market – they are usually on the wrong side of the market).

All the best,
Dunstan
 
 
  • Post #280
  • Quote
  • Mar 24, 2014 6:22am Mar 24, 2014 6:22am
  •  Dunstan
  • | Commercial Member | Joined Jul 2012 | 444 Posts
Quoting Connected
Disliked
Became immediately interested in the COT report after Ransqwauks news read CFTC says net EUR long position USD 9.2bln, increased by 46% Would love to hear feedback on the current EURUSD COT report please. {image}
Ignored
Hi Connected,

Here is my view on the Euro market.
There wasn’t any significant change in Traders positions this week, so we’ve got no cot change signal now. The extreme is getting larger towards the bearish side of the market, but it’s not that obvious yet… I mean if Commercials were at about 100-120.000 contracts net short / Large Specs 100-120.000 contracts net long, the extreme would be much clearer. If you think about it, they’ve still got approx. 60-80.000 contracts “space” left to reach these levels, which would be a definite bearish cot extreme level. Of course larger, as I call them, relative cot extremes can have the “power” to influence the market, but it’s much harder to act on these signals. The All Time bullish cot extreme signal from mid 2012 is still in place, prices are rallying since. As time passed and the extreme changed to the other side, it wouldn’t be too wise to think seriously about further and long term rallies in EUR, thus if I had long positions here, I’d be gradually scaling out of these positions / taking profits rather than adding to the position size. I could also say, I might be looking for good short opportunities knowing that the cot extreme that we have now is bearish (even if it is not that large yet).

All the best,
Dunstan
Attached Image (click to enlarge)
Click to Enlarge

Name: Report11_EUR.png
Size: 259 KB
 
 
  • Commercial Content
  • /
  • Follow the Smart Money / COT Analysis
  • Reply to Thread
    • 1 1213Page 141516 42
    • 1 13Page 1415 42
0 traders viewing now
  • More
Top of Page
  • Facebook
  • Twitter
About FF
  • Mission
  • Products
  • User Guide
  • Media Kit
  • Blog
  • Contact
FF Products
  • Forums
  • Trades
  • Calendar
  • News
  • Market
  • Brokers
  • Trade Explorer
FF Website
  • Homepage
  • Search
  • Members
  • Report a Bug
Follow FF
  • Facebook
  • Twitter

FF Sister Sites:

  • Metals Mine
  • Energy EXCH
  • Crypto Craft

Forex Factory® is a brand of Fair Economy, Inc.

Terms of Service / ©2023