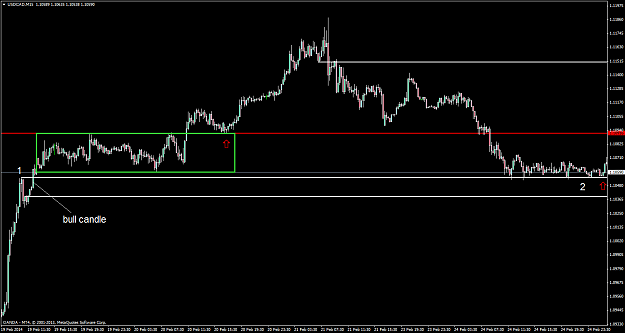
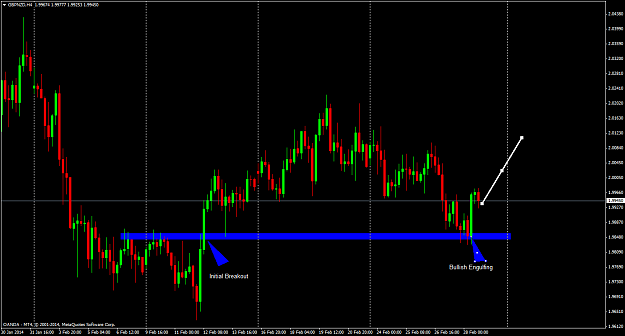
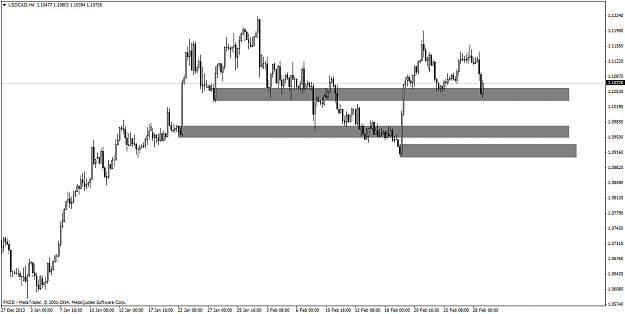
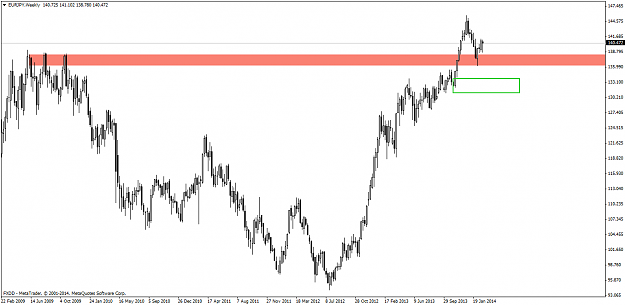
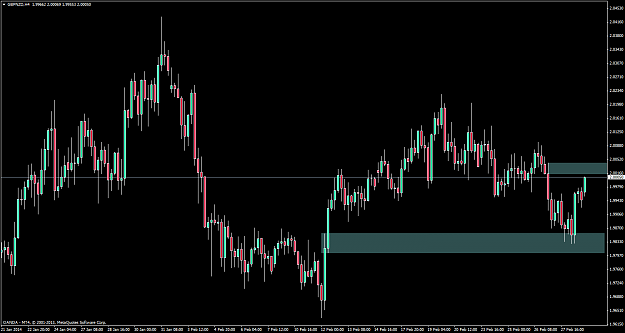
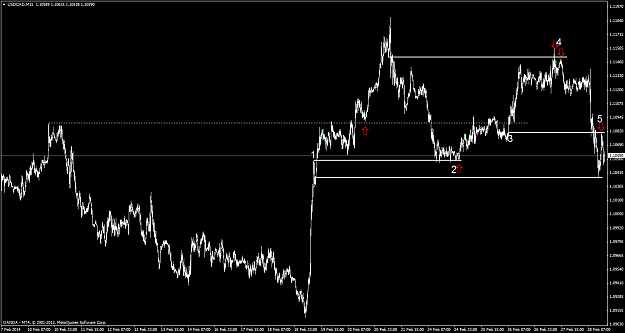
Sorry I had to make the PA small to get everything on the pic. The hashed horizontal line represents an area that price completely engulfed. Just before engulfing however at 1 price "hiccups". Price then flags (consolidates) above 1. It exceeds the flag but revisits the flag's upper border as shown by the red arrow.
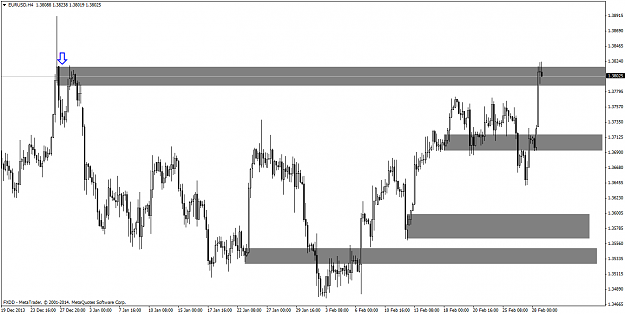
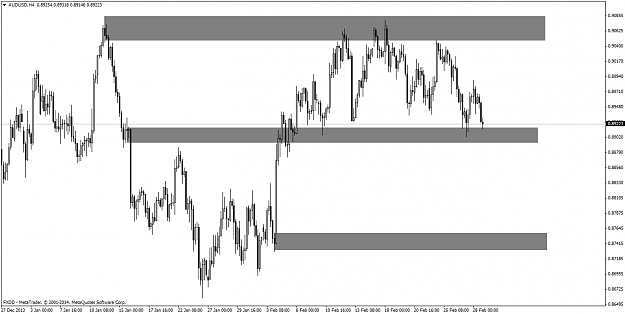
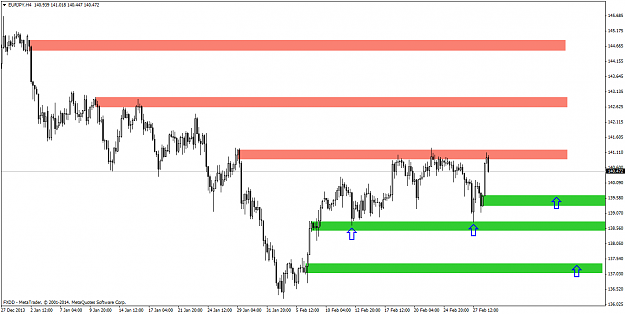
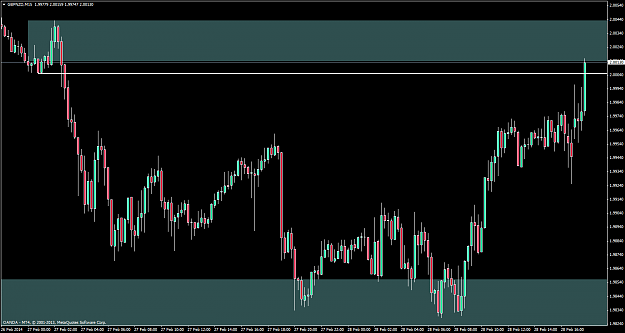
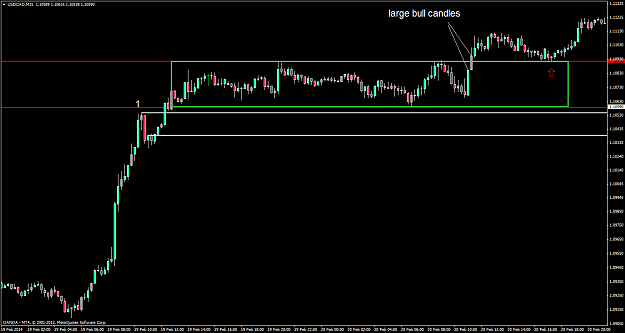
The next chart I zoomed in a bit. I've outlined the flag in green. Notice the two large bull candles that engulf out of the flag. This is supremely important. The red arrow represents the first trade long.
The next chart I zoomed in a bit. I've outlined the flag in green. Notice the two large bull candles that engulf out of the flag. This is supremely important. The red arrow represents the first trade long.
Attached Image (click to enlarge)
Attached Image (click to enlarge)