• Home
  • Forums
  • Trades
  • News
  • Calendar
  • Market
  • Brokers
  • Login
  • Join
  • User/Email: Password:
  • 1:25pm
Menu
  • Forums
  • Trades
  • News
  • Calendar
  • Market
  • Brokers
  • Login
  • Join
  • 1:25pm
Sister Sites
  • Metals Mine
  • Energy EXCH
  • Crypto Craft

Options

Bookmark Thread

First Page First Unread Last Page Last Post

Print Thread

Similar Threads

Creating Metatrader DLLs with Lazarus / Free Pascal 103 replies

any one trading forex with just Triangles? 0 replies

Help: Problem getting File Mapping working with MT4/pascal dll 3 replies

Pascal's Triangle as MM 45 replies

  • Trading Journals
  • /
  • Reply to Thread
  • Subscribe
  • 10
Attachments: The Semi-definitive guide to Pascal's Triangles in Forex
Exit Attachments
Tags: The Semi-definitive guide to Pascal's Triangles in Forex
Cancel

The Semi-definitive guide to Pascal's Triangles in Forex

  • Last Post
  •  
  • Page 1 2 3
  • Page 1 2 3
  •  
  • Post #1
  • Quote
  • First Post: Feb 9, 2014 10:30am Feb 9, 2014 10:30am
  •  twoblink
  • Joined May 2006 | Status: Member | 889 Posts
I had (a long time ago) posted about pascal's triangles and their use in Forex and in trading in general, this is an attempt to sort, organize, and cleanup all that information and have it located in a single place.

I think sometime in 2008(ish) I had a strange dream, very Kevin Costner Field of Dreams like. I was tackling the problem of optimized entry/re-entry/pyramiding of lot sizes. I recall that day on my private forum, stating "I woke up this morning and know the answer. The answer is Pascal's Triangle." I have no idea what that meant at the time, but as I investigated, I came upon quite the mathematical wonder that is the pascal's triangle, so I will make every attempt to explain it as best as I can below.

If you are trying to scale into, or scale out of, or pyramid into multiple positions, why is pascal's triangle a great choice?

Whenever we want to pyramid into a position, we would like to guarantee that the gradation of decrease in position size guarantees that the eventual sum of the gradation does NOT exceed the previous size. This is important so that if you have an open position, and decide to pyramid on that position, the additional positions at worst would make your original position break even, at best would leave you with a little bit of profit. In my search for such guarantees, I actually did find such guarantee; in the form of Phi.

Attached Image


Phi guarantees that, a singular phi-reduction step, and the sum of all it's subsequent steps, will __NOT__ exceed the original Phi entry point.

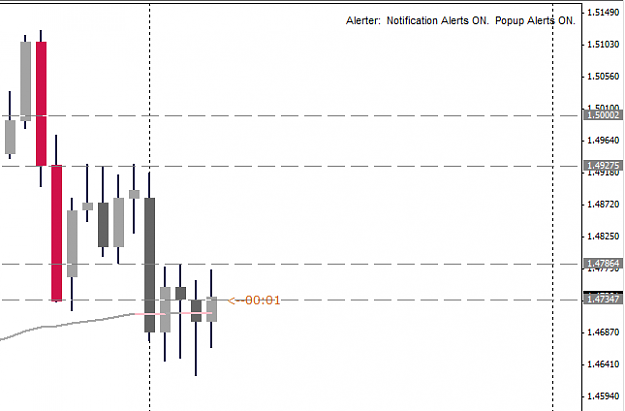
That is great photographically, but how do we put it mathematically? I discovered that we can do so somewhat easily by borrowing from the Fibonacci sequence.

Attached Image


In this example, given an initial entry @X as P0. Given the first pyramid point at X+34 as P1, we know that if P2 = is at X +34 + 21, with a positional SL at X+34+21-13, we can ALWAYS GUARANTEE that a pyramid action does no compromise the integrity of the average up. Thus this can be used for internally optimized and guaranteed SL pip-distance calculations.

Given the relationship then of asymptotically fib ratio approaching phi;

Attached Image


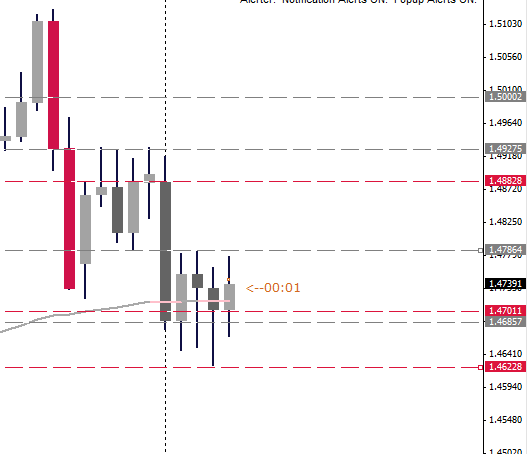
We then look at a Fib chart to maximize the potential of such use.

As your profit is really a mixture of lot size X distance covered; we can thus apply the same thing not just to distance, but to lot size as well.

1,1,2,3,5,8,13,21,34,55,89


Given a entry of 8.9 Lots;
An excellent pyramid point would be purchasing 3.4 lots when that position is showing a +55 pip profit.
The third pyramid point would then be 1.3 lots when the 2nd position is showing an open + 21 pip profit.

In doing so; you internally maximize risk reward to near optimized ratios; without the need to actually do the heavy lifting.

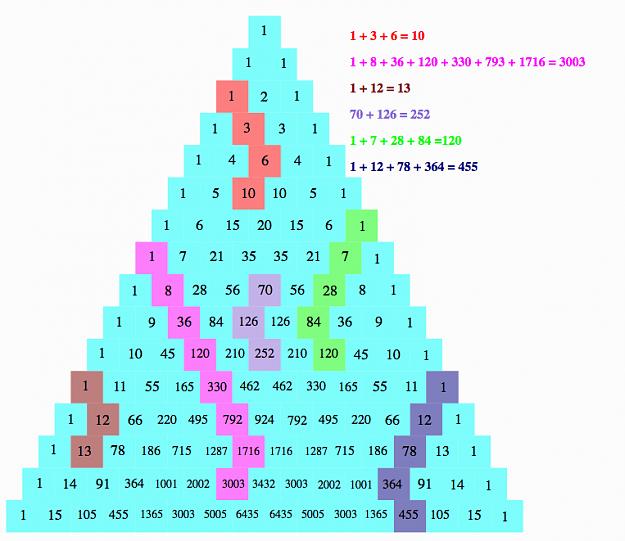
Since Pascal's Triangle is nothing more than a matrix view of the Fibonacci sequence;

Attached Image


We can then apply the pascal's triangle to our advantage.

Within the pascal's triangle, if you move one level down from left to right, if your final movement is bent the opposite; (from right to left) then you will obtain the sum of that amount.

Attached Image (click to enlarge)
Click to Enlarge

Name: pascal_hockey_sums.jpg
Size: 307 KB


Thus giving the characteristic "Hockey Stick" look.

Attached Image


I will go ahead and take the Orange hockey stick as an example from above. (21,15,5,1)

Given that I would like to pyramid up in symmetric intervals, say at +20 pips, and would like to do so for up to 4 times before I exit my position because I think +80 pips is very realistic in say, EURUSD, I take a look at the and pick the Orange Hockey Stick.

Given initial entry @X0. Initial price entry point (P), Lot size = 2.1

Conservative: I pick -28 pips as my SL. So P-28 = SL.
Moderate: I pick -35 pips as my SL. So P-35 = SL.
Aggressive: I pick -56 pips as my SL. So P-56 = SL.
(Note, my SL's are all picked around the last number on the orange hockey stick, the #21.)

At P+20, I enter again, 1.5 lots
At P+20+20 I enter again, 0.5 lots
At P+20+20+20 I enter again, 0.1 lots
At P+20+20+20+20 I exit all positions and take profit.

That's a fixed pip interval hockey stick pyramid; by manipulation of lot size only.

Here's a variation on that, non-fixed interval.

Given initial entry @X0. Initial price entry point (P), Lot size = 2.1

Conservative: I pick -28 pips as my SL. So P-28 = SL.
Moderate: I pick -35 pips as my SL. So P-35 = SL.
Aggressive: I pick -56 pips as my SL. So P-56 = SL.
When we reach P+21, we enter a 2nd time, (@X1), Lot size = 1.5
When we reach P+21+15, we enter a 3rd time (@X2), Lot size = 0.5
When we reach P+21+15+5...
I normally wouldn't bother with the final pyramid, and would just exit at this point.
This is using the pascal's triangle to optimize both lot size as well as interval.
If you are somewhat conservative or the market is thrashing about and you are not that secure; you can then this and have either a trailing SL or 28,34,or 56, depending on your risk tolerance.

If you sit there and crunch out the numbers as I'm sure some of you will; it is not fully fully optimized but pretty darn close! You don't need to then run a 3 variable chart of optimization for interval, lot size, and SL. The pascal's triangle does all that for you!!

The next example is a is what I call a "Pascal Leftie".

For this example I will be using the blue/purple hockey stick with the series (84,56,21,6,1)

Given initial position @X0, P, Lot size = 8.4, [email protected] (Stay with me here)

Given the purple hockey stick to be the position size; I will use the hex to the LEFT of it as my interval. So it will look like:

Given X0, P, LS =8.4, SL=P-45
X1 = P+36, LS = 5.6, SL = P+36-45
X2 = P+36+28, LS = 2.1, SL = P+28+36-45
X3 = P+36+28+7, LS = 0.6, SL = P+7+28+36-45 OR in my case, I usually just exit all positions here.

I use the hockey stick itself as the lot size determinant, and the hex to the left of it as my interval.

There are many MANY other methods to use the hockey sticks, too many to mention as I'm sure this will drum up some drastic discussions; but know that it is to be used first and foremost for good; and also never EVER EVER EVER use it to average down (you should never average down anyways).

I'm sure there will be a billion questions, I will do the best I can to answer them, but I hope I have made a decent introduction to the world of use of pascal's triangle as a pre-made solution to near fully optimized chart for pyramiding without the heavy math involved for optimizational determinants.
google:
  • Post #2
  • Quote
  • Feb 9, 2014 11:17am Feb 9, 2014 11:17am
  •  stt
  • Joined Apr 2013 | Status: Always Learning | 345 Posts
Interesting concept. If you have not yet checked, see technical analysis fallacy thread. Fti talks about method using golden ratio but reverse of what you suggest here. Both ways have different rationals.
Think : Trade : Live Life
 
 
  • Post #3
  • Quote
  • Edited 11:48am Feb 9, 2014 11:34am | Edited 11:48am
  •  shellsnail
  • Joined Aug 2012 | Status: Trends, Levels, Confirmation, Bayes | 1,834 Posts
Quoting twoblink
Disliked
I had (a long time ago) posted about pascal's triangles and their use in Forex and in trading in general, this is an attempt to sort, organize, and cleanup all that information and have it located in a single place. I think sometime in 2008(ish) I had a strange dream, very Kevin Costner Field of Dreams like. I was tackling the problem of optimized entry/re-entry/pyramiding of lot sizes. I recall that day on my private forum, stating "I woke up this morning and know the answer. The answer is Pascal's Triangle." I have no idea what that meant at the...
Ignored
hmm correct me if I am wrong but the assumption made here is that the probability of price moving further in your favour does not change as price moves in your favour right? or does that not matter.

In other words, your method is the optimal entry method conditional on the fact that price moves X amount of pips. But in real trading when the X is a random variable in itself with a probability distribution, is it still the optimal entry method?
Build good relationships with others.
 
 
  • Post #4
  • Quote
  • Feb 9, 2014 11:39am Feb 9, 2014 11:39am
  •  twoblink
  • Joined May 2006 | Status: Member | 889 Posts
Quoting shellsnail
Disliked
{quote} hmm correct me if I am wrong but the assumption made here is that the probability of price moving further in your favour does not change as price moves in your favour right? or does that not matter.
Ignored
You are wrong.

If I place a position in, and then place another one @ +21, but place another one @ +13, I assume that:

P => P+21 = work unit 1
P+21 => P+21+13 = work unit 2
with probability of work unit 1 = work unit 2.

It matters.

It is saying that if for example, I have a 73% chance that it will move up 21 pips, then perhaps at that point, there is another 73% chance that it will move up another 13 pips. As you are correct, if you wanted the same equal percentage of being correct (again) then the interval of correctness shrinks. Why pyramiding should only get smaller, not larger.
google:
 
 
  • Post #5
  • Quote
  • Feb 9, 2014 11:41am Feb 9, 2014 11:41am
  •  twoblink
  • Joined May 2006 | Status: Member | 889 Posts
Quoting stt
Disliked
Interesting concept. If you have not yet checked, see technical analysis fallacy thread. Fti talks about method using golden ratio but reverse of what you suggest here. Both ways have different rationals.
Ignored
The reverse violates mathematics; as does Averaging down. I've covered this in my insanely extensive journal.
google:
 
 
  • Post #6
  • Quote
  • Feb 9, 2014 11:41am Feb 9, 2014 11:41am
  •  shellsnail
  • Joined Aug 2012 | Status: Trends, Levels, Confirmation, Bayes | 1,834 Posts
Quoting twoblink
Disliked
{quote} You are wrong. If I place a position in, and then place another one @ +21, but place another one @ +13, I assume that: P => P+21 = work unit 1 P+21 => P+21+13 = work unit 2 with probability of work unit 1 = work unit 2. It matters. It is saying that if for example, I have a 73% chance that it will move up 21 pips, then perhaps at that point, there is another 73% chance that it will move up another 13 pips. As you are correct, if you wanted the same equal percentage of being correct (again) then the interval of correctness shrinks. Why pyramiding...
Ignored
But what if the actual probability by testing large sample sizes estimates to be,

for a particular P based on a set-up,

P -> P+15 (50%)
P+15 -> P+50 (50%)

what would be the optimal in that case? still using pascal triangle?

or phrase it another way, given a random variable X for price movement, what is the probability distribution applied to X that this pascal triangle being the optimal method is conditional upon? Is it a uniform distribution? Normal distribution? etc.
Build good relationships with others.
 
 
  • Post #7
  • Quote
  • Feb 9, 2014 11:50am Feb 9, 2014 11:50am
  •  twoblink
  • Joined May 2006 | Status: Member | 889 Posts
Quoting shellsnail
Disliked
{quote} In other words, your method is the optimal entry method conditional on the fact that price moves X amount of pips. But in real trading when the X is unknown, is it still the optimal entry method?
Ignored
Not true either. Well, let me take that back; it is a system to optimize quickly, or nearly optimize quickly a pyramiding interval system, be it interval of SL, of lot size, or of next entry size, or all of it. It does NOT provide any optimizations for entry, as how would you know what a good entry is?

Let's say I entered a long position with no real target; then next time I checked, it shows a +35Pip profit. Assuming that I didn't have a SL earlier, I could put an SL now at -56 pips from my current position (P+35-56), but buy another lot, with now a planned additional purchase at P+35+21. (Assuming I'm moving horizontally on the pascal chart).

As I've stated in my journal previously:

F(x) to be the entry
Given G(F(x)) to be the exit

We then know that PL = [G(F(x)) - F(x)]

Given no exit; we would not have a context of what is a good entry, so no optimization is available for entry.

Given a long entry point by Alice and Bob both at USDJPY 100.00

Alice exits at 103.21 for a profit of 321 pips.
Bob exits at 98.00 for a loss of 200 pips.

Both entries were the same. Entries cannot be determined to be optimal until point of exit. Any attempt to optimize entry is the assuming that you know which direction the price will go and for how much and for how long. If you did, it would mean you had superior inside information, and at that point, every entry point is optimum, since you are guaranteed an exit.
google:
 
 
  • Post #8
  • Quote
  • Feb 9, 2014 11:53am Feb 9, 2014 11:53am
  •  shellsnail
  • Joined Aug 2012 | Status: Trends, Levels, Confirmation, Bayes | 1,834 Posts
Quoting twoblink
Disliked
{quote} Not true either. Well, let me take that back; it is a system to optimize quickly, or nearly optimize quickly a pyramiding interval system, be it interval of SL, of lot size, or of next entry size, or all of it. It does NOT provide any optimizations for entry, as how would you know what a good entry is? Let's say I entered a long position with no real target; then next time I checked, it shows a +35Pip profit. Assuming that I didn't have a SL earlier, I could put an SL now at -56 pips from my current position (P+35-56), but buy another lot,...
Ignored
So basically this assumes that each uptick and downtick is equally likely at each instance, i.e. p=0.5? market is completely random right; any entry is as good as any other.

thanks.

but if that's the case then no edge can ever be present and no profits can be generated so the net outcome of the optimisation must be p/l = 0? sorry if these are stupid questions, just trying to understand the method..!
Build good relationships with others.
 
 
  • Post #9
  • Quote
  • Feb 9, 2014 12:03pm Feb 9, 2014 12:03pm
  •  twoblink
  • Joined May 2006 | Status: Member | 889 Posts
Quoting shellsnail
Disliked
{quote} But what if the actual probability by testing large sample sizes estimates to be, for a particular P based on a set-up, P -> P+15 (50%) P+15 -> P+50 (50%) what would be the optimal in that case? still using pascal triangle? or phrase it another way, given a random variable X for price movement, what is the probability distribution applied to X that this pascal triangle being the optimal method is conditional upon? Is it a uniform distribution? Normal distribution? etc.
Ignored

Assuming
P => P+15 (50%)
P+15 => P+50 (50%)

If this is the case, you trading the "crest" or near crest of the distribution interval curve, in which case, Pascal's triangle is STILL the optimal.

Given P, P+15, P+50, P+65,

Assuming your probability is true; then I would then trade a 1,4,6,4,1 against it. Entry, crescendo, apex, decrescendo, exit.

But what you propose is rare; because we know this from horsepower, work, 80/20 and basically any and all of nature.

What you propose is that getting a car to increase +15 horsepower costs X dollars, but increasing it another +50 horses also costs X dollars. In theory, possible, rare as hen's teeth in reality. I would mean that shaving my mile time by 20 seconds in a week, and then in the following week after that, I saved it by almost a full minute. I would bet against that happening with all the money I have each and every time!

I wrote a book called "The 97% Man" in which I argue that if society put all its efforts on reaching the 97%, since the final 3% usually costs the same or up to 6x more than the previous 97% with almost no visible or noticeable improvements, it would stand to reason we should ask everybody around us for their 97% effort. Of course, if you stand with me on this theory, we should then never have Olympic athletes.
google:
 
 
  • Post #10
  • Quote
  • Feb 9, 2014 12:06pm Feb 9, 2014 12:06pm
  •  shellsnail
  • Joined Aug 2012 | Status: Trends, Levels, Confirmation, Bayes | 1,834 Posts
Quoting twoblink
Disliked
{quote} Assuming P => P+15 (50%) P+15 => P+50 (50%) If this is the case, you trading the "crest" or near crest of the distribution interval curve, in which case, Pascal's triangle is STILL the optimal. Given P, P+15, P+50, P+65, Assuming your probability is true; then I would then trade a 1,4,6,4,1 against it. Entry, crescendo, apex, decrescendo, exit. But what you propose is rare; because we know this from horsepower, work, 80/20 and basically any and all of nature. What you propose is that getting a car to increase +15 horsepower costs X dollars,...
Ignored
Ok I think I roughly get it. Does it mean you pick the peak of the probability distribution of X and do a pascal triangle set-up around it? If there's no peak then any point is as good as any other so you start with the largest lot size..?

Hmm but forex does display these signs. Like for example you'll trading short into a key support level in a downtrend, once price breaks a key support it'll accelerate downwards and travel a lot more.

Another example, each pair has an average daily range, if London goes in a certain direction, it's more likely US session will follow suit as long as ADR is not fulfilled. Also, the high OR the low of each day tends to be made during NY session.
Build good relationships with others.
 
 
  • Post #11
  • Quote
  • Feb 9, 2014 12:15pm Feb 9, 2014 12:15pm
  •  twoblink
  • Joined May 2006 | Status: Member | 889 Posts
Quoting shellsnail
Disliked
{quote} So basically this assumes that each uptick and downtick is equally likely at each instance, i.e. p=0.5? market is completely random right; any entry is as good as any other. thanks. but if that's the case then no edge can ever be present and no profits can be generated so the net outcome of the optimization must be p/l = 0? sorry if these are stupid questions, just trying to understand the method..!
Ignored

Absolutely not stupid.

Given price; given nothing known about it. 50% chance of uptick, as 50% chance of downtick.

OK, now we get into so quantum theory; quantum spin, and quantum cryptography.

Quantum Theory and Newtonian theory says; an object at rest tends to stay at rest; an object in motion tends to stay in motion. If the price as moved up 1 pip; quantum theory says, perhaps undetectable, but that previous +1 pip movement has exerted a micro force on the price, the market, the psyche of the traders etc.. in the up direction.

It is what I call a "Micro Propensity to move in the last direction it moved". If you yawn in a crowded room, chances are excellent someone else (lots of someone else's) will yawn as well. Now price isn't yawning; but if you believe in quantum physics as it applies to everything around you, then you are forced to apply it to price theory and model as well.

The second reason I'll give you is the coin flip answer.

Let's say you walked by and you saw a guy flipping a coin. He tells you that he's going to flip it 1 million times. While you stand there, he flips a heads. You walk away. 2 years later, you hear that the coin was tested, and it was shown to be not fully balanced, that it had a weight bias to it. Based on your ONE SINGULAR OBSERVATION, if you had to guess that the coin was biased (which you now know), what side would you guess the bias to be? The reasonable man HAS TO GUESS HEADS. Why? Assuming that the coin was flipped a million times, and that there was a bias, your seeing of a single coin flip landing heads means you guess heads would give you the micro statistical advantage. We only know that there's a weight bias to the coin, we don't even know if statistically that effected the results. But the fact that it might, and the fact that you saw heads, gives you the "Micro advantage" of guessing heads and guessing right.
google:
 
 
  • Post #12
  • Quote
  • Feb 9, 2014 12:20pm Feb 9, 2014 12:20pm
  •  twoblink
  • Joined May 2006 | Status: Member | 889 Posts
Quoting shellsnail
Disliked
{quote} Ok I think I roughly get it. Does it mean you pick the peak of the probability distribution of X and do a pascal triangle set-up around it? If there's no peak then any point is as good as any other so you start with the largest lot size..? Hmm but forex does display these signs. Like for example you'll trading short into a key support level in a downtrend, once price breaks a key support it'll accelerate downwards and travel a lot more. Another example, each pair has an average daily range, if London goes in a certain direction, it's more...
Ignored
Let us say, the USDJPY has had a daily range of 89 pips. And all it does is run around this range. If it hit one side of the range, I would enter and put in an exit at +55 pips. Because optimally, I know that if 89pip movement is the range, then internally, I know that there's a +61.8% chance that the rebound will move +55 pips. How do I know? Because given a range of 89 pips, 55pips internally is the ratio of the golden ratio, and thus the percentage of the ratio of the golden ratio. Sweet huh?

If I know we are 55 pips away from the NYMarket Low, then I can enter and set an exit at +34 pips; because I also know that I have a > 50% chance to be right. In fact, (again) if what you tell me is true, then we would then know we have again a 61.8% chance that it will happen. Mathematically, probability is now on your side.
google:
 
 
  • Post #13
  • Quote
  • Feb 9, 2014 12:28pm Feb 9, 2014 12:28pm
  •  shellsnail
  • Joined Aug 2012 | Status: Trends, Levels, Confirmation, Bayes | 1,834 Posts
Can we do an example - to illustrate the practical application a bit more thanks!

Given these four levels, shown by the grey lines
Attached Image (click to enlarge)
Click to Enlarge

Name: Screenshot1.png
Size: 17 KB


The lowest at 1.4735 is the first entry and the 1.500 is the determined exit, and 1.4786 and 1.49275 are the levels which once cleared would greatly increase the chance the next level will be hit, how should I enter if I want to risk a total of say 10 lots?
Build good relationships with others.
 
 
  • Post #14
  • Quote
  • Feb 9, 2014 12:36pm Feb 9, 2014 12:36pm
  •  twoblink
  • Joined May 2006 | Status: Member | 889 Posts
Quoting shellsnail
Disliked
Can we do an example - to illustrate the practical application a bit more thanks! Given these four levels, shown by the grey lines {image} The lowest at 1.4735 is the first entry and the 1.500 is the determined exit, and 1.4786 and 1.49275 are the levels which once cleared would greatly increase the chance the next level will be hit, how should I enter if I want to risk a total of say 10 lots?
Ignored
Given a 1,4,6,4,1 Distribution which seems near symmetrical to your graph resistance shape;

Given the 1's as out of bounds:

Given 4+6+4 = 14 but you wanted a total of 10 lots

Given 10/14 = .714

Given 4 * 0.714 = 2.856
Given 6 * 0.714 = 4.284

Entry X0 Up @ 1.4735 @ 2.8 lots
Entry X1 Up @ 1.4787 @ 4.2 lots
Entry X2 Up @ 1.4928 @ 2.8 lots
Exit all @ 1.4999
Total risk 9.8 lots
google:
 
 
  • Post #15
  • Quote
  • Feb 9, 2014 12:39pm Feb 9, 2014 12:39pm
  •  shellsnail
  • Joined Aug 2012 | Status: Trends, Levels, Confirmation, Bayes | 1,834 Posts
Quoting twoblink
Disliked
{quote} Given a 1,4,6,4,1 Distribution which seems near symmetrical to your graph resistance shape; Given the 1's as out of bounds: Given 4+6+4 = 14 but you wanted a total of 10 lots Given 10/14 = .714 Given 4 * 0.714 = 2.856 Given 6 * 0.714 = 4.284 Entry X0 Up @ 1.4735 @ 2.8 lots Entry X1 Up @ 1.4787 @ 4.2 lots Entry X2 Up @ 1.4928 @ 2.8 lots Exit all @ 1.4999 Total risk 9.8 lots
Ignored

Nice! How do we factor the SL placement into this, if say initially it is below the low..
Attached Image


Thanks in advance.
Build good relationships with others.
 
 
  • Post #16
  • Quote
  • Feb 9, 2014 12:40pm Feb 9, 2014 12:40pm
  •  twoblink
  • Joined May 2006 | Status: Member | 889 Posts
I must say, though with a disclaimer, you made DRASTIC assumptions about price levels, didn't really mention total risk tolerance.

If you are trading visually, I'd put the SL exactly where you have it. If you are trading mathematically, I'd put the SL as:

(1.47345 - [1.49275-1.47864])

Equivalent to the largest gap'ed span you are asking your price action to move.
google:
 
 
  • Post #17
  • Quote
  • Edited 12:54pm Feb 9, 2014 12:43pm | Edited 12:54pm
  •  shellsnail
  • Joined Aug 2012 | Status: Trends, Levels, Confirmation, Bayes | 1,834 Posts
Quoting twoblink
Disliked
I must say, though with a disclaimer, you made DRASTIC assumptions about price levels, didn't really mention total risk tolerance.
Ignored
yeah... I am getting a bit confused lol am trying to wrap my head around it...

Do you think it'd work if I tried putting all these variables into a constrained maximisation and see if I can come up with optimal values for the lot sizes to aim for a certain reward:risk ratio conditional upon the probabilities p1,p2,p3 where price will move past each level? and then I can freely assign values to p1,p2,p3 either by subjective probability or some other method.

I think what I am asserting is, the probability p* of price touching TP before touching SL from the entry point is not equal to

p1 (probability of price touching level 1 without touching SL) * p2 (probability of price from level 1 touching TP without touching SL), because these events are not independent.
Build good relationships with others.
 
 
  • Post #18
  • Quote
  • Feb 9, 2014 12:57pm Feb 9, 2014 12:57pm
  •  twoblink
  • Joined May 2006 | Status: Member | 889 Posts
Do I think what will work? Since I don't trade the same as you; you'd do well to not heed my examples as anything more than examples.

Without trying to sound snark; you seem to have your heart set on Support/Resistance breakout trading; but trying to shove interval trading into it.

If you think that once a price breaks your magical price point (and I admit it, even I have biases towards certain price points) and you think then the price will take off; then I would think the simplest method then is to just use the internal ratios and nothing else.

If the distance from magic line 1 to magic line 2 is 90 pips; and the price just broke magic line 1, then for your form of trading; it seems much easier to play it like red/black on a roulette. -55 SL, vs +89 Profit exit. THAT'S IT. No need to make it harder than it is. If you have a > 61.8% probability, then you will get +89 pips profit. If you don't, then you will lose -55 pips. Internalized, that's all you really need to do; bet on black or red.

Note that because it's a move of +89 to the plus side and -55 on the minus side; it's not a 50/50%. It's a 61.8%/38.2% vario that is needed to actually reach +89 vs reaching -55.

Remember, your probability of hitting the SL or PT is 100%. So it's 100% MINUS something; with a sum total of 100%. You can't have 60% of reaching your TP and 60% of your SL. It's not possible mathematically. So they are not only not independent; but the formula is (100%-the other guy).
google:
 
 
  • Post #19
  • Quote
  • Feb 9, 2014 1:05pm Feb 9, 2014 1:05pm
  •  shellsnail
  • Joined Aug 2012 | Status: Trends, Levels, Confirmation, Bayes | 1,834 Posts
Quoting twoblink
Disliked
Do I think what will work? Since I don't trade the same as you; you'd do well to not heed my examples as anything more than examples. Without trying to sound snark; you seem to have your heart set on Support/Resistance breakout trading; but trying to shove interval trading into it. If you think that once a price breaks your magical price point (and I admit it, even I have biases towards certain price points) and you think then the price will take off; then I would think the simplest method then is to just use the internal ratios and nothing else....
Ignored
yeah hmm ok i will think about it. it's tough because there's a time component, i.e. these events take place sequentially..

so maybe the way to do it is to treat each interval as separate, enter 4 lots at the entry, with magic line 1 being the target and the SL 61.8% of the gap and then once magic line 1 is reached, enter 6 lots and shift the SL up to 61.8% of the gap between the new entry and magic line 2, and do the same for magic line 3. does that make sense? (basically treat it as 3 separate trades, but when doing the position sizing initially treat it as one trade and split the lot size accordingly)

Well it does sound like a reasonable approach to me lol, just not sure if it'll work or if in fact any method actually works better than another!
Build good relationships with others.
 
 
  • Post #20
  • Quote
  • Feb 9, 2014 1:11pm Feb 9, 2014 1:11pm
  •  shellsnail
  • Joined Aug 2012 | Status: Trends, Levels, Confirmation, Bayes | 1,834 Posts
Quoting shellsnail
Disliked
{quote} yeah hmm ok i will think about it. it's tough because there's a time component, i.e. these events take place sequentially.. so maybe the way to do it is to treat each interval as separate, enter 4 lots at the entry, with magic line 1 being the target and the SL 61.8% of the gap and then once magic line 1 is reached, enter 6 lots and shift the SL up to 61.8% of the gap between the new entry and magic line 2, and do the same for magic line 3. does that make sense? (basically treat it as 3 separate trades, but when doing the position sizing...
Ignored
lol I just tried it and guess what, turns out SL 1 is exactly the same as SL 2! Sl 3 is the 2nd red line.

so basically enter at 1.4735 with 4 lot, SL at 1.470, then enter again at 1.4786 when it breaks and retraces with 6lot, not moving the SL, then finally enter 1.49275 with 4 lot when it breaks and retraces, shifting SL up to 1.488 for all positions.

ok I hope this didn't deviate too far from what you were trying to say :/..

Attached Image


An extension. Let's say you wish to impose a restriction on the SL to be the low of the set-up, in that case simply take a retrace entry as follows, and you end up with those 3 stop-losses...

Attached Image
Build good relationships with others.
 
 
  • Trading Journals
  • /
  • The Semi-definitive guide to Pascal's Triangles in Forex
  • Reply to Thread
    • Page 1 2 3
    • Page 1 2 3
0 traders viewing now
  • More
Top of Page
  • Facebook
  • Twitter
About FF
  • Mission
  • Products
  • User Guide
  • Media Kit
  • Blog
  • Contact
FF Products
  • Forums
  • Trades
  • Calendar
  • News
  • Market
  • Brokers
  • Trade Explorer
FF Website
  • Homepage
  • Search
  • Members
  • Report a Bug
Follow FF
  • Facebook
  • Twitter

FF Sister Sites:

  • Metals Mine
  • Energy EXCH
  • Crypto Craft

Forex Factory® is a brand of Fair Economy, Inc.

Terms of Service / ©2023