Hi guys wasnt here around for a while, gathering experiences in matter of vsa and been a busy, so here s my trade described in img. Hopefully it will go well.{image}
Ignored
you are buying in a clear downtrend. Also, the bar you've marked with the arrow shows that price went up, and back down. essentially an upthrust, a sign of weakness.
{quote} you are buying in a clear downtrend. Also, the bar you've marked with the arrow shows that price went up, and back down. essentially an upthrust, a sign of weakness.
Ignored
</p>
<p></p>
<p></p>
If there were a full selling why it had struggling to break those small sized up bars on the left? Think about cum.vol. and look at the 15m it went down on systematically decreasing vol. After fthe huge vol. I think it will go back to the high vol. Area. And buyed couse of huge gap that it might be corrected.
<p>{quote}</p> <p></p> <p></p> If there were a full selling why it had struggling to break those small sized up bars on the left? Think about cum.vol. and look at the 15m it went down on systematically decreasing vol. After fthe huge vol. I think it will go back to the high vol. Area. And buyed couse of huge gap that it might be corrected.
Ignored
I agree with RaverStyle, weekly nightmare is unfolding. I wouldn't anticipate down move if not just scalping 20-30 pips at a time.
<p>{quote}</p> <p></p> <p></p> If there were a full selling why it had struggling to break those small sized up bars on the left? Think about cum.vol. and look at the 15m it went down on systematically decreasing vol. After fthe huge vol. I think it will go back to the high vol. Area. And buyed couse of huge gap that it might be corrected.
Ignored
There is also no selling climax, and it is not in the markup phase as well. just pure downtrend. could be just a stall waiting for more distrubution. at least looking at that specific timeframe on the image.
{quote} Could you expand on this please 1pip? do you mean because we are at the weekly trendline and could possibly move either way?
Ignored
Weekly has been showing long upper wicks for weeks. Really bad idea trading GU atm but doing it anyway She really is at resistance, is she breaking through or falling like a rock? I don't know. Time will tell.
Good day!
I'm going to spread your daily analysis on financial instruments (EUR/USD, GBP/USD, USD/JPY, GOLD, SILVER, WTI, S&P500, USD/RUB, AUD/USD, USD/CAD) in this topic. Analysis is based on volumes, prices and time. Timeframe H1. I decided to show here how the analysis of volumes allows you to choose the right direction for making decisions in the markets. Hope to see like-minded people on this forum.
I'm from Russia, so I apologize in advance for my English
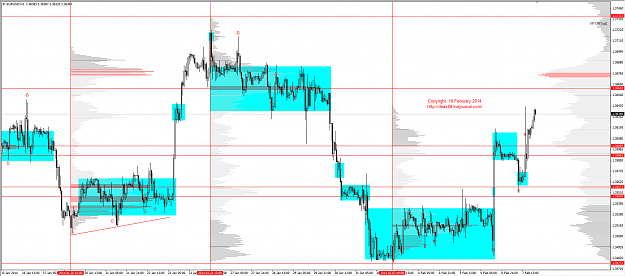
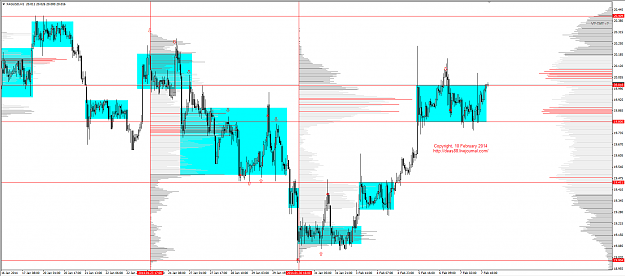
Market Review 10.02.2014(EUR/USD,GBP/USD,USD/JPY,XAU/USD,XAG/USD,WTI,S&P500,USD/RUB,USD/CAD,AUD/USD)EUR/USD
On Friday, we have implemented a scenario last review. Price decreased 1.3545-1.3560 area and NFP rose to 1.3640. Monday considering buying in the range 1.3590-1.3600, with a stop for the previous accumulation zone and the purpose of 1.3660.
Attached Image (click to enlarge)
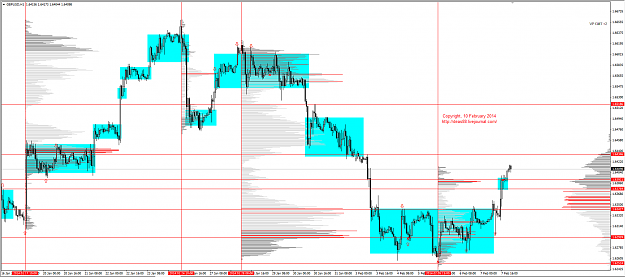
GBP/USD
Pound on the news made sharp provocation and retest the previous volumes in the 1.6290-1.6310. And for Friday gave us profit 1.6400. Monday considering buying a short stop in the area of 1.6375-1.6390, but only when there will be volumes in this area.
Attached Image (click to enlarge)
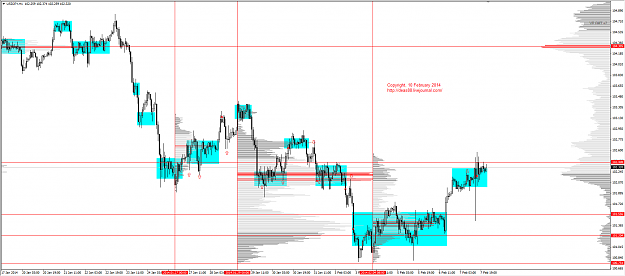
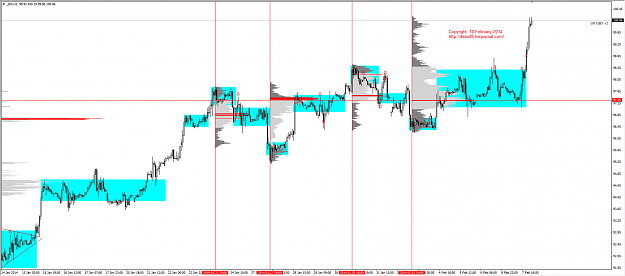
USD/JPY
Jena as I expected on Friday went in both directions. Just very quickly made return prices back. So on Monday expect lateral movement with a possible retest 101.20-101.55 zone , where I will try to buy with a stop below the low of the last week and aim 102.93 .
Attached Image (click to enlarge)
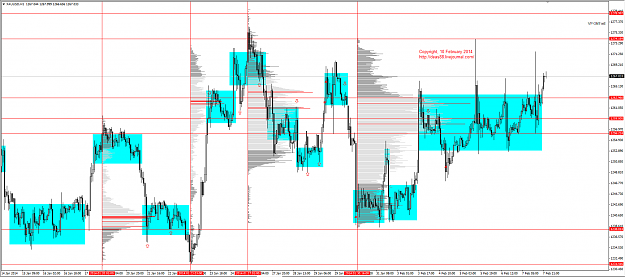
XAU/USD
Gold is still difficult to say something. Zone of strong accumulation volumes 1256-1263. We are above the zone, so possible move higher. But for me, the situation remains uncertain.
Attached Image (click to enlarge)
XAG/USD
Silver continues to consolidate in the range of 19.80-20.10. Waiting for silver today provocation above the maximum 20.25. And if followed by a sharp price refund back to accumulation zone will try to sell with a stop at 20.45 and 19.45 purpose.
Attached Image (click to enlarge)
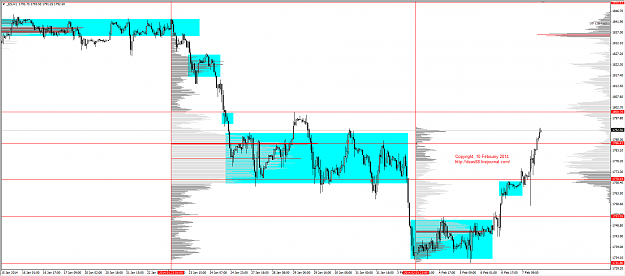
WTI
On Friday, I was selling futures on oil, but we have dramatically upgraded highs. Now I expect the formation of a new zone of accumulation of volumes that will be more than the previous area 97.30-98.30. And only then will take some action.
Attached Image (click to enlarge)
S&P500
Index entered the zone of the previous accumulation. No large amounts. Currently considering provocative Update 1800, and there will try to sell the index.
Attached Image (click to enlarge)
USD/RUB
Continue to expect provocations below 34.45 or the emergence of large volumes. When returning prices will buy with the objectives 34.93, 35.10-35.20.
Attached Image (click to enlarge)
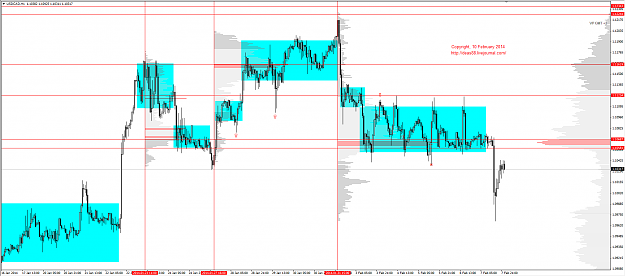
USD/CAD
Made out of the accumulation zone 1.1060-1.1120. So, I will consider selling the pair in the 1.1060-1.1070 stop 1.1130. Targets below Friday's low.
Attached Image (click to enlarge)
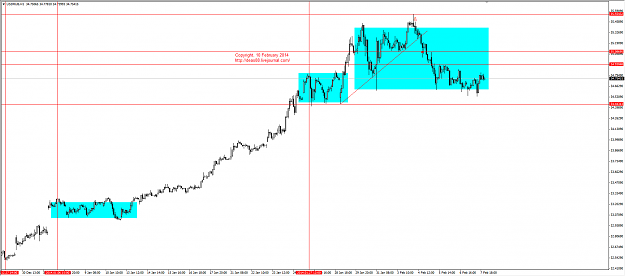
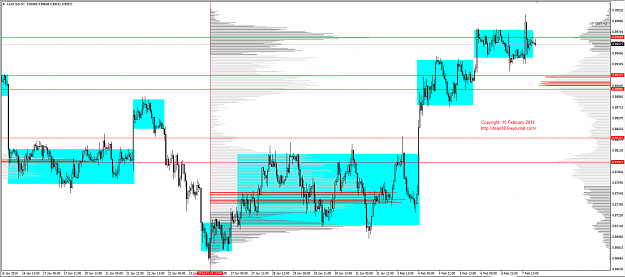
AUD/USD
Forward price 0.8915 to buy, stop 0.8870 and 0.8980 above objectives. Buy will only when large volumes appear, as there are fears provocation below 0.8870.
EUR/USD On Monday, the euro has consolidated in the range of 1.3630-1.3645 and showed price 1.3660 . On Tuesday I am considering buying 1.3635-1.3645 area with a stop for the previous accumulation zone and the purpose of 1.3700 .
GBP/USD British could buy twice as the European and the American session. All day the pound stood in the range of 1.6390-1.6415 . Today I consider the growth of the pound in the 1.6440-1.6500 area . But I do not rule updates with the following minimum 1.6382 taller than highs.
XAU/USD Zone of strong accumulation volume is 1256-1263. We took a maximum of 1279. But I'm staying out of the market. Maybe I will buy in the area of 1273-1275.
WTI On Monday, the price formed a new zone of accumulation 99.80-100.20. Oil did not show large amounts. I'm staying out of the market, do not rule updates the maximum.
S&P500 Index entered the zone of the previous accumulation. No large amounts. Currently considering provocative Update 1800, and there will try to sell the index.
USD/RUB Continue to expect provocations below 34.45 or the emergence of large volumes. When returning prices will buy with the objectives 34.93, 35.10-35.20.
Nice charts Deas, thanks for sharing with us, I am finding it difficult to identify the differences between accumulation trading areas and distribution - how to tell? Because last week I thought that EURUSD was distributing (when in fact we were accumulating!) major error which cost me dearly! So I traded the wrong way LOL! Anyway I learnt from this error, which is what matters most. ANy tips on how to tell if we are accumulating or distributing? Many thanks in advance for any ideas
Market Review 11.02.2014(EUR/USD,GBP/USD,USD/JPY,XAU/USD,XAG/USD,WTI,S&P500,USD/RUB,USD/CAD,AUD/USD) EUR/USD On Monday, the euro has consolidated in the range of 1.3630-1.3645 and showed price 1.3660 . On Tuesday I am considering buying 1.3635-1.3645 area with a stop for the previous accumulation zone and the purpose of 1.3700 . {image} GBP/USD British could buy twice as the European and the American session. All day the pound stood in the range of 1.6390-1.6415 . Today I consider the growth of the pound in the 1.6440-1.6500 area . But I do not...
Ignored
I really like your approach to the markets Deas, so you look for the acc/dist zones and then wait for a buy sell signal in your zones? very interesting thanks, I notice that you have no volume on your charts? Also please can you tell us what the red X is on your charts?
Nice charts Deas, thanks for sharing with us, I am finding it difficult to identify the differences between accumulation trading areas and distribution - how to tell? Because last week I thought that EURUSD was distributing (when in fact we were accumulating!) major error which cost me dearly! So I traded the wrong way LOL! Anyway I learnt from this error, which is what matters most. ANy tips on how to tell if we are accumulating or distributing? Many thanks in advance for any ideas
Ignored
Thank you! I've been watching the price of highs and lows, I select the accumulation zone volumes at these levels. For example, if we are forming at high volumes more than the previous minimum, I expect downtrend market. And then, if the minimum allocation is greater than the previous maximum, the market turns to the new storage volumes, more than the minimum.
{quote} I really like your approach to the markets Deas, so you look for the acc/dist zones and then wait for a buy sell signal in your zones? very interesting thanks, I notice that you have no volume on your charts? Also please can you tell us what the red X is on your charts?
Ignored
I'm waiting for the market formation of zones of accumulation volume, and then wait for a buy/sell signal in these zones, with a stop for the previous accumulation zone. I look at the volume in the other program. There I consider H1 bars for precise input. We must be careful as we can see provocations on the min and max of the market. Red arrow - is opening position, the red X - is the closing position (private arts ).
|
Joined Aug 2013
|
Status: The illest on the planet ^^
|13 Posts
hi Guys thanks for all support in previous thread D unfortunetly it ended kinda well...
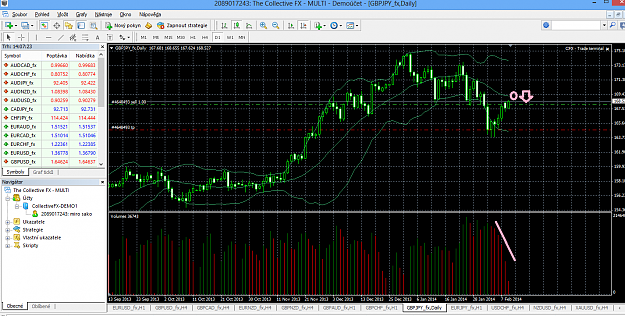
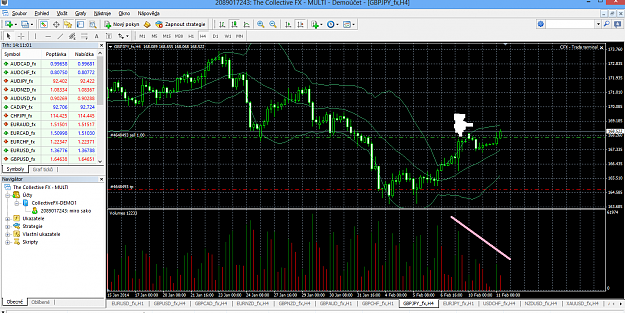
Next trade, Im expecting in Gb/jpy in D1 to bounce back from middle of bb and countinue down however its already goin up on decreasing vol. in h4
i already buyed and of course it surely or probably will touch the middle of bbs of daily but iam so annoyed of waiting so..
btw iam not a prophet thats just my thoughts iam not saying it will happen..peace
Market Review 12.02.2014(EUR/USD,GBP/USD,USD/JPY,XAU/USD,XAG/USD,WTI,S&P500,USD/RUB,USD/CAD,AUD/USD) EUR/USD Yesterday, the euro continued consolidation between the two zones of accumulation of 1.3635-1.3645 and 1.3660-1.3675 volumes. Draghi will speak today. I plan to buy on volumes. I do not rule out return prices to the area 1.3590-1.3610, but the goals remain the 1.3700-1.3750.
GBP/USD Pound 1.6380-1.6415 remains strong support zone. Yesterday, the price reached the goals today expect prices near 1.6520-1.6555. But while the British will not form at the peaks of the large accumulation zone volume, sales are not considered. There is a variant with a provocation to 1.6380 ( removal of stops ) and the course above, but will be watching.
USD/JPY Jena did not give a deep correction. She formed a new zone of accumulation volumes 102.05-102.45. I will watch the price in this area. I am considering buying after provocation just below 102 with a stop at 101.20 and goals 102.95, 103.45.
XAU/USD Price has not reached 1273-1275. Today I am going to buy in the area of the previous accumulation volumes 1281.50-1285 updates with the goals of maximum and with a stop in 1276.
XAG/USD Silver yesterday showed a large volume on the highs accumulation 19.80-20.25 on retest I opened sell. The aim is a lower bound accumulation 19.75-19.80.
WTI Price continues to shape the accumulation zone volumes 99.85-100.30. I'm staying out of the market and wait for large volumes or above the maximum provocation 100.50.
USD/RUB Continue to expect provocations below 34.45 or the emergence of large volumes. When returning prices will buy with the objectives 34.93, 35.10-35.20.
{quote} I'm waiting for the market formation of zones of accumulation volume, and then wait for a buy/sell signal in these zones, with a stop for the previous accumulation zone. I look at the volume in the other program. There I consider H1 bars for precise input. We must be careful as we can see provocations on the min and max of the market. Red arrow - is opening position, the red X - is the closing position (private arts ).
Ignored
Hi Deas thanks for sharing with us your perspectives on the market and how you trade based on accumulation and distributions zones, it is interesting and quite unique! May I please ask you how long have you been trading? many thanks
{quote} Hi Deas thanks for sharing with us your perspectives on the market and how you trade based on accumulation and distributions zones, it is interesting and quite unique! May I please ask you how long have you been trading? many thanks
Ignored
Hi! I have been trading on the market since 2003. But I trade this method only recently with the end of 2013 =) I checked on the history of correlation patterns in volumes and prices, accumulation zones and price behavior on highs and lows. I've gone from classical analysis (lines of support resistance, Fibo levels) from RSI divergence and wave method. All this does not give a complete picture of the market at the moment.
{quote} Hi! I have been trading on the market since 2003. But I trade this method only recently with the end of 2013 =) I checked on the history of correlation patterns in volumes and prices, accumulation zones and price behavior on highs and lows. I've gone from classical analysis (lines of support resistance, Fibo levels) from RSI divergence and wave method. All this does not give a complete picture of the market at the moment.
Ignored
Hi Deas, have you read Tom Williams book 'The undeclared secrets that drive the stock market'? I really recommend it, a very interesting book with regards to VSA. I am looking for a good book that speaks about accumulation and distribution areas and how to identify them as they develop. I was wondering with your analysis, if for example we were looking at EURUSD being in an accumulation stage, would this mean that the USD/CHF would have a high probability of being in a distribution phase?