TCI (Trading Center Indicator)
TCI is a Technical Analysis System (actually it is an indicator based on price action..)
I developed TCI during the past 13 years, originally it was a system designed to trade stocks & indices but after TCI was transformed into a system for analyzing Forex assets too.
TCI Basic Features:
1) It is based on a price action pattern incorporating closing prices, pivots and volatility
2) Incorporates two moving averages (basic valuation and correction)
3) may trade any financial market (stocks, indices, Forex, commodities)
4) may fit any time frame (but as I am a swing trader, it is usually set to analyze daily closings, daily pivots and daily volatility)
5) time frames are set according to the Fibonacci sequence of numbers (I can't explain further at the moment)
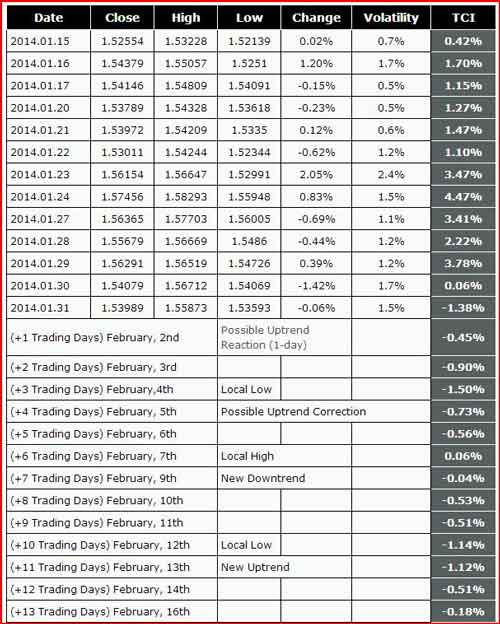
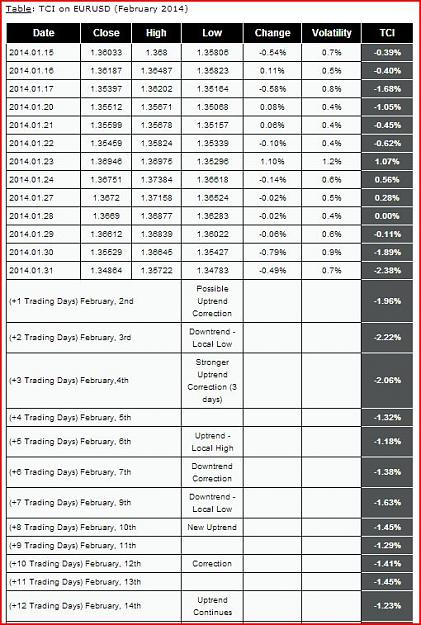
6) may be set backwards or forwards -Backward to define what to buy and forward to define when to buy..
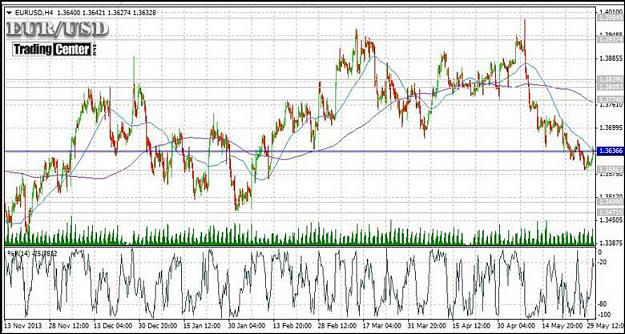
7) it can draw historical charts of any time frame (there is an example below of 2 different time frames)
TCI signals are published for free at the moment at my site TradingCenter.org
I am new at ForexFactory and I certainly hope that during the next months I will have the time to publish some Swing trading signals at ForexFactory too..
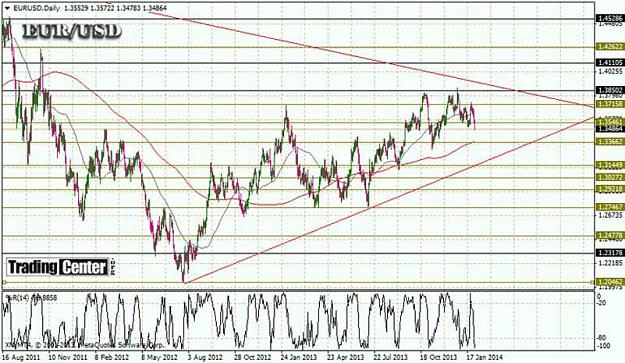
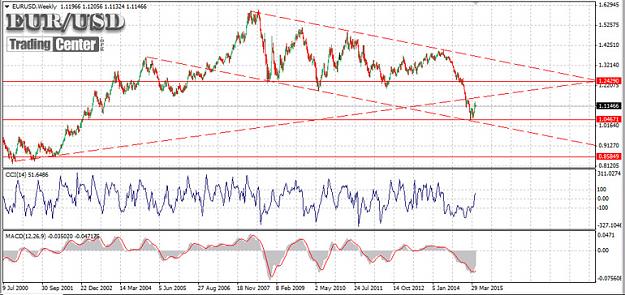
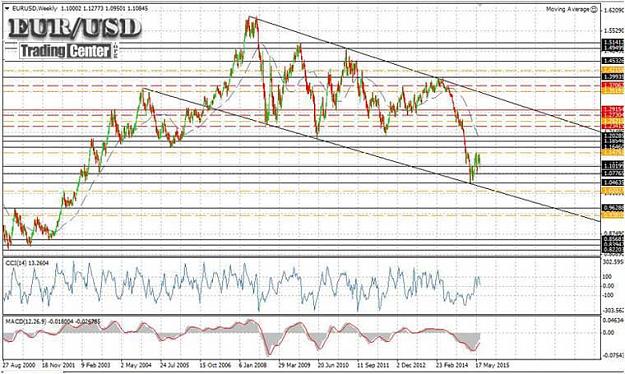
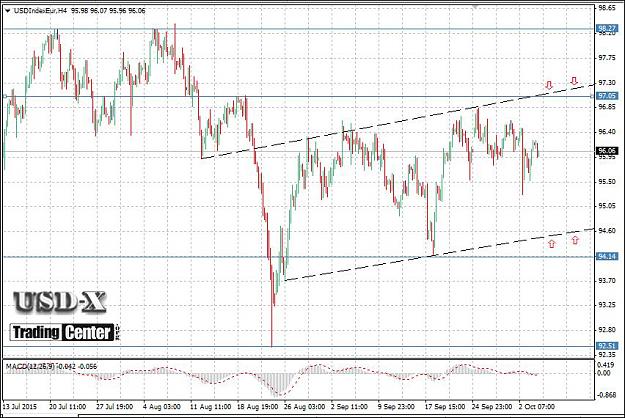
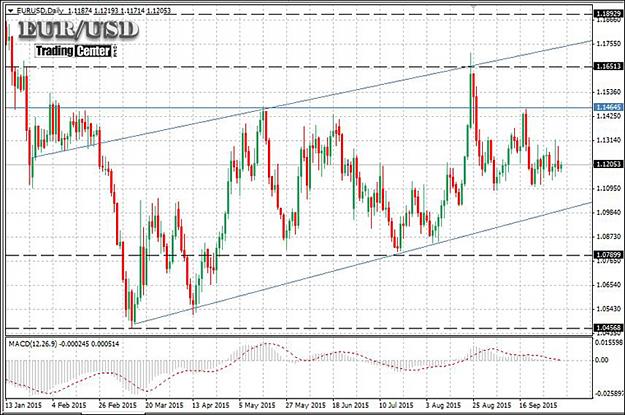
TCI on EURUSD
Here is EURUSD historic via two TCI versions (Long & Short Time Frame 2009-2013). We may observe that the level of TCI>45% has indicated highly overbought markets for EURUSD. The below chart refers to the period 2009-2013 (until August).
http://tradingcenter.org/images/sign...sd-27-7-13.jpgG. Protonotarios
TradingCenter.org