• Home
  • Forums
  • Trades
  • News
  • Calendar
  • Market
  • Brokers
  • Login
  • Join
  • User/Email: Password:
  • 7:11am
Menu
  • Forums
  • Trades
  • News
  • Calendar
  • Market
  • Brokers
  • Login
  • Join
  • 7:11am
Sister Sites
  • Metals Mine
  • Energy EXCH
  • Crypto Craft

Options

Bookmark Thread

First Page First Unread Last Page Last Post

Print Thread

Similar Threads

CRB Alien!! 214 replies

MT5 indicators for Alien’s trading systems 40 replies

Visual backtest result different from non-visual backtest 0 replies

Systems, Systems and Systems... 1 reply

“Alien Infector,” an MT4 script idea 2 replies

  • Trading Systems
  • /
  • Reply to Thread
  • Subscribe

Alien's Extraterrestrial Visual Systems

  • Last Post
  •  
  • Page 1 23456 1129
  • Page 1 2 1129
  •  
  • Post #1
  • Quote
  • First Post: Edited Nov 13, 2017 7:26am Dec 21, 2013 8:22am | Edited Nov 13, 2017 7:26am
  •  forexalien
  • Joined Nov 2012 | Status: Member | 13,906 Posts
Alien's Systems are a Group of Individual Systems, when used together, will give you Extraterrestrial Confidence with your trading, to pull the trigger , or stay out of the Markets when you should not be in them.

Intelligent and Adult like Behavior is the only rule, or you will be sent packing................Life is too short to waste on anything less then this.......Thank You !

Your input is welcome, as long as it follows the only rule here............

We will cover each System with it's Basic Methodology and then begin to add to them as time goes on.

Our Goal here, is to Learn How to stay on the correct side of the Trade.

When to trade and when NOT to Trade.

Alien is a Visual type of trader, Likes Momentum Trading, and can tell when the market is about to turn on Larger Time Frames and Small...........

Entries and Exits will be shown and why.........

Powerful Trend entries and how to find them.

How to stay in the trade with confidence. Ride the Trend to the End...........

The most Powerful Idea behind this Thread is to have Fun !

Alien does not live on this forum, he is off building UFO's, but visits several times a day, to reply to your questions...........

Let's get started now !

Alien Returns November 12th 2017.........
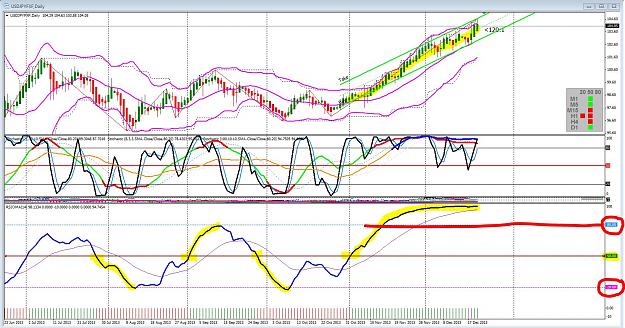
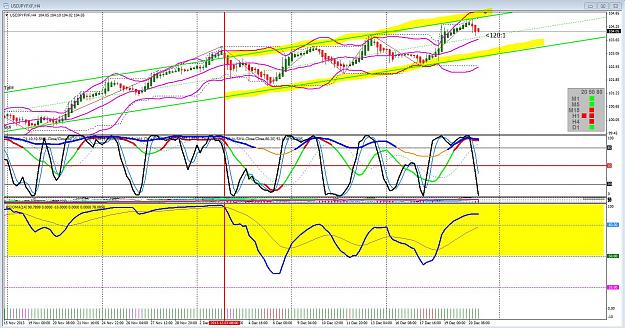
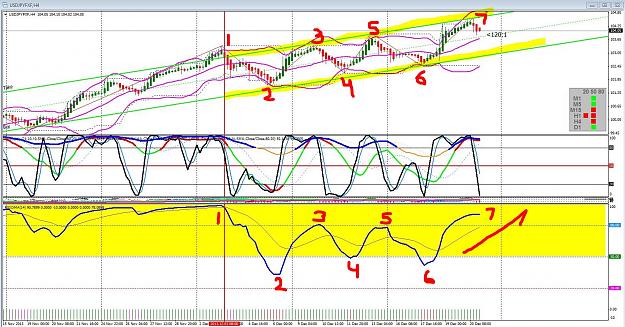
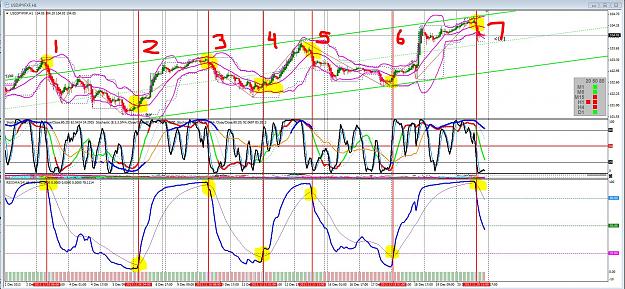
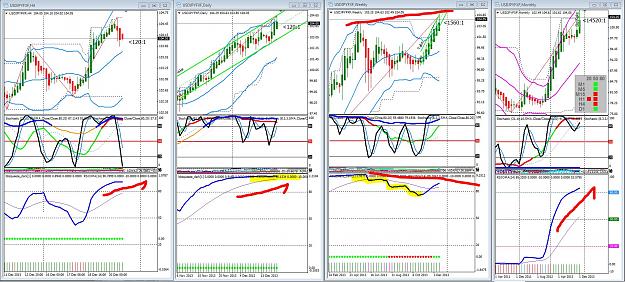
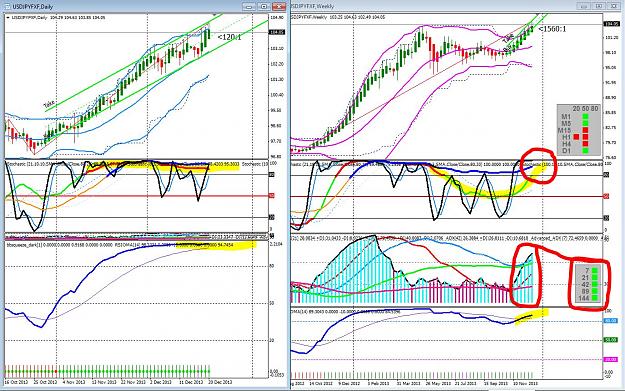
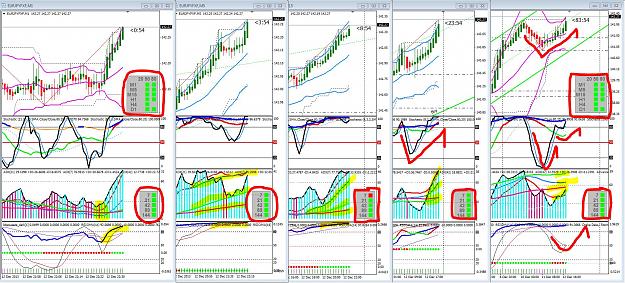
Attached Image
The More You Learn, The More You Earn.....
  • Post #2
  • Quote
  • Dec 21, 2013 8:42am Dec 21, 2013 8:42am
  •  forexalien
  • Joined Nov 2012 | Status: Member | 13,906 Posts
We are going to start off with learning the RSIOMA to keep us on the correct side of the trade. Later we will add to that, to show you long term direction that you can ride for weeks, to make the larger pip harvest...........

Weekend Food for thought. Simple System for locating Near Tops and Bottoms on Larger time frames or Smaller time frames...........

I started with the Daily and you will noticed the RSIOMA is compressed up against the top of it's window.

I then start looking for the same in the H4.

I also look for it in the H1 , M15 and then M5....... you can look for it in the M1 also , but I did not show that........but do use it......

Then I wait for the M1 and M5 to start unwinding to the south or short...........as the M15 follows the M5 and M1, I look for a place to start thinking about shorting it.

I Now Know where Price Action is NOT Going Much Higher and can safely enter shorts. You can spot Divergence in the RSIOMA as the PA drifts higher to a Reversal.........

You must monitor your trade once you set it, because it can retest the high again and may even go against you a bit but will not continue much higher with confidence.

You can now use this for finding bottoms and tops in all the intermediate Time Frames as the Price Action moves around............

This is how I keep on the correct side of my trades...........We will get more detailed with this system in time to show you why Price A
ction Turns on a Dime and takes it away from you..........

When there is not much space between the Two signal lines or they are flat around the 50% line , DO NOT TRADE during that time.......Wait for clear indications and power to move the Price Action....... We will be adding a special ADX system to this in the future to help you find great entries.........

I use this for scalping, swing trading and soon with long term position trading.......enjoy........Alien... ..........
Attached Images
Attached File
File Type: ex4 RSIOMA (2).ex4   7 KB | 19,074 downloads
The More You Learn, The More You Earn.....
3
  • Post #3
  • Quote
  • Dec 21, 2013 8:55am Dec 21, 2013 8:55am
  •  jpadvisor
  • Joined Jul 2013 | Status: Member | 2,587 Posts
I'll definitively subscribe to you thread, Alieno.
Per aspera ad astra :)
1
  • Post #4
  • Quote
  • Dec 21, 2013 9:09am Dec 21, 2013 9:09am
  •  forexalien
  • Joined Nov 2012 | Status: Member | 13,906 Posts
Alien likes to look at Multiple Time Frames to see the coming turns in the Market. As shown below.

Looking at the H1 on UJ - The RSIOMA is in the lower window, Ignor the other indicators for now.

The H1 RSIOMA is compressed high against the ceiling of the window "Marked A" , we are looking for a break of that compression to the downside.

You then look at the next lower time frame, the M15 to look for clues to when the H1 RSIOMA might break to the downside. Divergence in the price still climbing, and the RSIOMA is slowly falling away creating this Divergence, this is the clue that the H1 is soon to come down.

To take this one step further , you can look at the M5 and see the strong fake to the long side and then it crosses back down to give you a great entry.

As time goes on in this Thread , we will be adding other indicators that will give you more clues to when the price action will turn on a dime so you can be on the correct side of the trade.

I will feed this to you in small sections , so you will not get sensory overload and you will have the time for it to sink in and learn it................Alien
Attached Image (click to enlarge)
Click to Enlarge

Name: Alien RSIOMA teach 1.JPG
Size: 404 KB
The More You Learn, The More You Earn.....
2
  • Post #5
  • Quote
  • Dec 21, 2013 9:11am Dec 21, 2013 9:11am
  •  forexalien
  • Joined Nov 2012 | Status: Member | 13,906 Posts
Quoting jpadvisor
Disliked
I'll definitively subscribe to you thread, Alieno.
Ignored
Thanks , I plan on adding to this thread to keep the momentum going in here.................
The More You Learn, The More You Earn.....
1
  • Post #6
  • Quote
  • Dec 21, 2013 9:27am Dec 21, 2013 9:27am
  •  priceaction1
  • Joined Apr 2013 | Status: Now I know you | 5,764 Posts
good to see that alien home at FF. good luck. but you know the mother of all indicators is ...............
don't predict direction, but dance with flow of water
1
  • Post #7
  • Quote
  • Edited at 11:41am Dec 21, 2013 9:28am | Edited at 11:41am
  •  forexalien
  • Joined Nov 2012 | Status: Member | 13,906 Posts
Let me back up a Minute....... Keeping it Simple here......

We are looking at a UJ Daily Chart

When the RSIOMA is Above 50% the market is Long.........

When the RSIOMA is Below 50% the market is Short.........

When the RSIOMA is over 80% this is a Strong Trend, You place a trade and the trend has been in place for over a month, about 600 pips. now that's a trade !

The same goes for when it is below 20%, you better be short.

If you are afraid of trading the Daily, trade Micro's ...........600 pips on a micro is $60 profit and then gear up from there depending on your account size.

Next we will look at checking the other Time Frames of UJ to see what they tell us and what clues they might have for us.

Also we will talk about all pairs in here, I am just using UJ for the moment..............
Attached Image (click to enlarge)
Click to Enlarge

Name: Alien RSIOMA teach 2.JPG
Size: 291 KB
The More You Learn, The More You Earn.....
  • Post #8
  • Quote
  • Dec 21, 2013 9:29am Dec 21, 2013 9:29am
  •  forexalien
  • Joined Nov 2012 | Status: Member | 13,906 Posts
Quoting priceaction1
Disliked
good to see that alien home at FF. good luck. but you know the mother of all indicators is ...............
Ignored
No I don't , What is the Mother of all Indicators..................?
The More You Learn, The More You Earn.....
1
1
  • Post #9
  • Quote
  • Dec 21, 2013 9:45am Dec 21, 2013 9:45am
  •  forexalien
  • Joined Nov 2012 | Status: Member | 13,906 Posts
So it is clear that the Daily is still Long, and you must keep that in mind when you start to look at the lower time frames to pick your entries.

Alien always says it's long until you are proven different............

We see the H4 UJ here, and I high lighted the above 50% area, and you can see the RSIOMA is spending a lot of time in this area, which would tell you the market is Long.

I am not ready to talk about channels yet, but you can see the RSIOMA staying above 50% most the time and the price action coming off the lower trend line and moving to the upper trend line for entries and exits to be taken.

The Daily will turn down at some point in time, your need to watch the H4 for that to start happening.

As the RSIOMA starts to move to less than 50% and spend more time below 50%, a Daily retrace will be happening or a trend change on the Daily will be starting.
Attached Image (click to enlarge)
Click to Enlarge

Name: alien RSIOMA 3.JPG
Size: 281 KB
The More You Learn, The More You Earn.....
  • Post #10
  • Quote
  • Dec 21, 2013 9:57am Dec 21, 2013 9:57am
  •  jpadvisor
  • Joined Jul 2013 | Status: Member | 2,587 Posts
According to your RSIOMA US/Yen is still bullish. So this is your main indi, right?
Per aspera ad astra :)
1
  • Post #11
  • Quote
  • Dec 21, 2013 10:03am Dec 21, 2013 10:03am
  •  forexalien
  • Joined Nov 2012 | Status: Member | 13,906 Posts
You have seen the H4 UJ.

Now lets match it up to the H1 UJ

Not knowing when the H4 will make it's next turn, I look at the H1, which gives you clear turns. You can take this example and keep going with it.

Not knowing when the H1 will turn, go look at the M15, and then the M5 and you can scalp with the M1
Attached Images (click to enlarge)
Click to Enlarge

Name: alien RSIOMA 4 H1  marked to match H4.JPG
Size: 282 KB Click to Enlarge

Name: alien RSIOMA 4 H1.JPG
Size: 384 KB
The More You Learn, The More You Earn.....
1
  • Post #12
  • Quote
  • Dec 21, 2013 10:15am Dec 21, 2013 10:15am
  •  forexalien
  • Joined Nov 2012 | Status: Member | 13,906 Posts
Quoting jpadvisor
Disliked
According to your RSIOMA US/Yen is still bullish. So this is your main indi, right?
Ignored
This is my quick look trend direction indicator. I start with larger time frames and look for multiple time frames to have the same direction for a trade. This will also in time teach you the quicker turns of the lower time frames for scalping. For safer trading, I like to use the ADX for momentum, and multiple stochastics for finding extreme tops and bottoms. I will talk about those in the days to come...........

TIP: RSIOMA - When H4 is long and H1 is short and M15 is Long and M5 is short, this equals "Ranging" or a lot of chop. Sit on your hands at this time.

Last TIP : When the RSIOMA is FLAT with no strong direction or is just hanging around the 50% line with no direction. Don't trade........go find another pair to look at.
Attached Image
The More You Learn, The More You Earn.....
2
  • Post #13
  • Quote
  • Dec 21, 2013 10:30am Dec 21, 2013 10:30am
  •  forexalien
  • Joined Nov 2012 | Status: Member | 13,906 Posts
Quoting jpadvisor
Disliked
According to your RSIOMA US/Yen is still bullish. So this is your main indi, right?
Ignored
Looking at your question for UJ.

Monthly is Clearly Long - looking at chart below........

The Weekly is showing signs of Divergence like in my first EJ example talking about the RSIOMA - you can see price going higher and the RSIOMA is falling lower.

The week RSIOMA has crossed long, But this is where the Divergence comes in. also looking at the daily , it is near a top also , compressed against the ceiling waiting to break and come down. The H4 will help us find that break as you watch them together. H4 is still long, as the H4 breaks short again , it my or may not bring the Daily down with it this time, but you will know when that happens by watching the RSIOMA over time , you too will get to understand how to anticipate the turns of the market.
Check the H1 to anticipate the H4 turn as shown..............
Attached Image (click to enlarge)
Click to Enlarge

Name: alien RSIOMA UJ divergence higher tfs.JPG
Size: 380 KB
The More You Learn, The More You Earn.....
  • Post #14
  • Quote
  • Dec 21, 2013 10:37am Dec 21, 2013 10:37am
  •  jpadvisor
  • Joined Jul 2013 | Status: Member | 2,587 Posts
Do you find divergences always reliable on your system? and btw you use to spot also hidden div.? Tnk
Per aspera ad astra :)
  • Post #15
  • Quote
  • Dec 21, 2013 10:52am Dec 21, 2013 10:52am
  •  FerruFx
  • Joined May 2007 | Status: MT4/MT5 EAs/Indicators/Alerts coder | 6,795 Posts
ForexAlien, what's the small dashboard shown in the bottom right of your chart ?
MT4/MT5 EAs/Indicators/Alerts coder
1
  • Post #16
  • Quote
  • Dec 21, 2013 11:07am Dec 21, 2013 11:07am
  •  forexalien
  • Joined Nov 2012 | Status: Member | 13,906 Posts
Quoting jpadvisor
Disliked
Do you find divergences always reliable on your system? and btw you use to spot also hidden div.? Tnk
Ignored
I use the divergence for a clue of the slowing of the price action in the trend direction, the pull back could be smaller and slower to happen, but if you go look at the daily UJ it is nearing a drop also, which in turn will drop the weekly that just turned long and a week long at that.............

The week chart below , the ADX shows strong and long for now, looking at the daily below, the price action of daily long has created that ADX long on the weekly.
The RSIOMA Daily is compressing for a drop, only the action of the H4 and H1 will help us with the timing of that drop.

In the weekly chart you can see a Green Stochastic that has turned back long because of the daily long, this 21,10,10 sma mimcs price action, it is another first go to indicator for trend direction.

Ultimately we will learn to enter at a trend start, with momentum and learn when to get out and not exit the trade early like we all do..............

Humans are impatient, overtrade and this becomes their down fall................
Attached Image (click to enlarge)
Click to Enlarge

Name: alien RSIOMA UJ divergence higher tfs 2.JPG
Size: 281 KB
The More You Learn, The More You Earn.....
  • Post #17
  • Quote
  • Dec 21, 2013 11:25am Dec 21, 2013 11:25am
  •  FerruFx
  • Joined May 2007 | Status: MT4/MT5 EAs/Indicators/Alerts coder | 6,795 Posts
Quoting FerruFx
Disliked
ForexAlien, what's the small dashboard shown in the bottom right of your chart ?
Ignored
Don't need to answer ... I found the answer myself
MT4/MT5 EAs/Indicators/Alerts coder
1
  • Post #18
  • Quote
  • Dec 21, 2013 11:29am Dec 21, 2013 11:29am
  •  forexalien
  • Joined Nov 2012 | Status: Member | 13,906 Posts
Quoting FerruFx
Disliked
ForexAlien, what's the small dashboard shown in the bottom right of your chart ?
Ignored
You made me smile ............!

I use 2 different dashboards for a quick glance on how the market is trending .

The one FerruFx is referring to is the 20 50 80 multiple TF's , it lets me know in a glance where all the stochastics are sitting.

I will find a trending example for you to look at.

The first example I found is of the ADX in multiple TF's Trending strongly........... second set of windows below have my ADX, the dashboard beside each time frame show different speeds of ADX , 7,21,42,89,144, when the dash board turns all Green Boxes, a strong trend is in place Long or Short, this is an long example.

The 2 dash boards in the chart area on top that FerruFx was asking about, show me that the 8,3,3, and 21,10,10 stochastics are all above the 50% line at the same time and most are above the 80% line also showing me a strong trend in place, these are where you want to be when you place a trade.

Just look at the Price action on all time frames..............

A simple dash board glance to tell you a trend is HOT !
Attached Image (click to enlarge)
Click to Enlarge

Name: 12_12_13 ej long all tfs.JPG
Size: 436 KB
The More You Learn, The More You Earn.....
1
  • Post #19
  • Quote
  • Dec 21, 2013 11:31am Dec 21, 2013 11:31am
  •  forexalien
  • Joined Nov 2012 | Status: Member | 13,906 Posts
Quoting FerruFx
Disliked
{quote} Don't need to answer ... I found the answer myself
Ignored
Too Funny..........you are !
The More You Learn, The More You Earn.....
1
  • Post #20
  • Quote
  • Dec 21, 2013 11:31am Dec 21, 2013 11:31am
  •  FerruFx
  • Joined May 2007 | Status: MT4/MT5 EAs/Indicators/Alerts coder | 6,795 Posts
Quoting forexalien
Disliked
{quote} You made me smile ............!
Ignored
Yes found the answer after posting!
MT4/MT5 EAs/Indicators/Alerts coder
1
  • Trading Systems
  • /
  • Alien's Extraterrestrial Visual Systems
  • Reply to Thread
    • Page 1 23456 1129
    • Page 1 2 1129
2 traders viewing now
  • More
Top of Page
  • Facebook
  • Twitter
About FF
  • Mission
  • Products
  • User Guide
  • Media Kit
  • Blog
  • Contact
FF Products
  • Forums
  • Trades
  • Calendar
  • News
  • Market
  • Brokers
  • Trade Explorer
FF Website
  • Homepage
  • Search
  • Members
  • Report a Bug
Follow FF
  • Facebook
  • Twitter

FF Sister Sites:

  • Metals Mine
  • Energy EXCH
  • Crypto Craft

Forex Factory® is a brand of Fair Economy, Inc.

Terms of Service / ©2021