{quote} Bear trappist? Why? Because no volume and previous bullist candle? {image}
Ignored
I was not totally bearish.
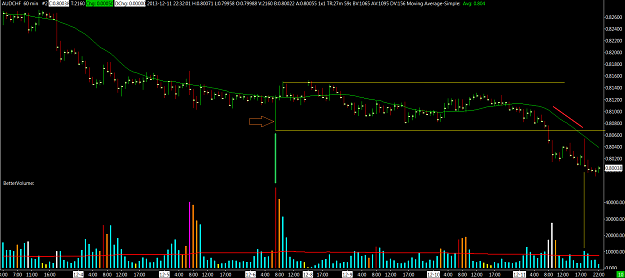
If you look back, on 5/12 around 8 o'clock, you will see we had stopping volume but the market could not be marked up since we saw SOW around 0,8400. After that we started seeing LH and LL. Upcandles had decreasing volume.
{quote} I see this as weakness. Selling does occur on high volume down bars.. The close of that bar was on its low, I'd rather wait for a down bar with high volume and a close towards the middle to label it as strength. Take a look at the orange bar from London, it has higher volume than the bar in question and yet the market pushed below this bar, telling me that its a weak market. Once the weak bar printed I would be looking for shorts, not longs. The highest volume bar for yesterday, in blue, looks like it could be a shake out, but it if it was...
Ignored
Hi SimpelDev,
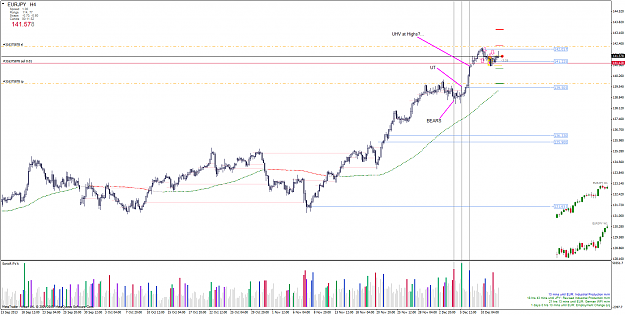
EJ was in an uptrend from on 5/12 and until it had recently started its downtrend on 10/12. It is suprising for me how EJ started its downtredn in silence without showing a buying climax. I would like to see a buying climax and a distribution phase before I would think that the downtrend is a solid one. Otherwise I would call it as a temporary retrecament. What do you think about this ?
{quote} I was not totally bearish. If you look back, on 5/12 around 8 o'clock, you will see we had stopping volume but the market could not be marked up since we saw SOW around 0,8400. After that we started seeing LH and LL. Upcandles had decreasing volume.
Ignored
Many thanks Trappist, that is more like the way I analyze the market. Is this the SV that you refer?
{quote} Hi SimpelDev, EJ was in an uptrend from on 5/12 and until it had recently started its downtrend on 10/12. It is suprising for me how EJ started its downtredn in silence without showing a buying climax. I would like to see a buying climax and a distribution phase before I would think that the downtrend is a solid one. Otherwise I would call it as a temporary retrecament. What do you think about this ?
Ignored
Its a good way to trade.
Sounds like you need to figure out what type of trader best fits you. Swing or day trader? Aggressive or conservative? The only wrong way to trade is a way that doesn't fit you. Each have their pros and cons.
If you are wanting to wait for a full distribution and a trend to develop then conservative is the way to go for you. If you gravitate more towards 1h and 4h and daily charts then you might be better off as a swing trader. Just going off that you are seeing the trend from back on December 5th.
I found that I am better trading levels from high volume bars, so I tend to gravitate towards them. I try my best to be a better long term charts I do ok, but I am better intraday. The point is, you have to trade was best fits you and not what you want be.
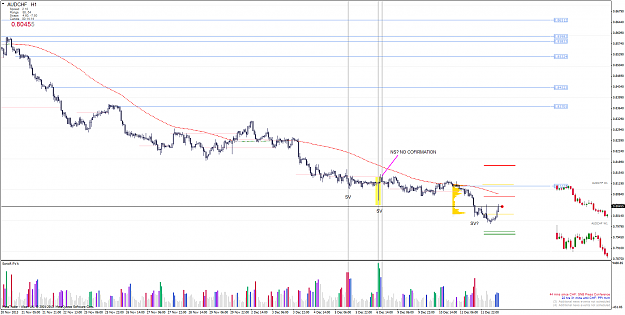
{quote} Many thanks Trappist, that is more like the way I analyze the market. Is this the SV that you refer? {image} This is like I see EJ What do you think? {image} Thanks
Ignored
Okay, revealing a trading secret. Sorry for using your pic fex
Volume aside, if you see this in an uptrend and better yet if you see this at some of your s/r area, then this is most probably continuation. Long it is.
{quote} Okay, revealing a trading secret. Sorry for using your pic fex Volume aside, if you see this in an uptrend and better yet if you see this at some of your s/r area, then this is most probably continuation. Long it is. {image}
Ignored
No sorry, thanks. Sorry, I dont understand what is this?
{quote} you are right really no need for moving averages however ..... using something like trend diamonds or a hulls stops you form trying to pick tops and bottom one trader in the thread though they saw a low vol test on 60 and went long , not sure if they are stopped out , but we see no demands on a 15 min at top of current 60 min range , suggesting this move continues sunday / monday . In addition hulls on a 15 is red all thru london , .. why trade against this ? a simple hulls being red says no longs till that sign of strength is confirmed...
Ignored
Hi SimpleDev,
Mal is talking often about hulls and recommends to use it. In his post he says "[highlight=rgba(255, 255, 255, 0)]a simple hulls being red says no longs till that sign of strength is confirmed " . [/highlight]
[highlight=rgba(255, 255, 255, 0)]Is it not the same thing to wait for a higher high with increasing volume, and then a higher low with decreasing volume, which means strength is confirmed ?[/highlight]
Hi 1pipperhour thanks fro your comments the area that you highlighted with the circle on the 4H chart please can you expand on the theory behind this, would it be that we have high volume buying into the selling? I can see those tall upper wicks and long lower shadows, looks like a tug of war going on!
{quote} Okay, revealing a trading secret. Sorry for using your pic fex Volume aside, if you see this in an uptrend and better yet if you see this at some of your s/r area, then this is most probably continuation. Long it is. {image}
{quote} Hi SimpleDev, Mal is talking often about hulls and recommends to use it. In his post he says "a simple hulls being red says no longs till that sign of strength is confirmed " . Is it not the same thing to wait for a higher high with increasing volume, and then a higher low with decreasing volume, which means strength is confirmed ?
Ignored
Yes, he was basically using hulls as a trend indicator, so by all means if you want to use HHs and HLs as a trend indicator then go for it.
It is still the same principle of stopping volume, confirm trend has changed then entering off NS/Tests.
Not trying to pick on you Kingford, but basically trading with the trend may save you from trades like these. I used hulls for a few years and then found out that I prefer a 21 sma for trend.
You can see how EJ rejected the SMA and price came down.
*Disclaimer*
I am not saying put a SMA on your chart and trade the rejections, good chance you will lose money in the long run.
Hey whats up guys. I have a couple questions concerning some bars in the VSA methodology...
1. An above avg(wide spread) up/ down bar on low volume?
2. A narrow range upbar on high volume in a downtrend?
3. A narrow range downbar on high volume in uptrend?
4. A narrow range, high volume downbar closing off its lows in a downtrend with the next bar doing the same thing?
{quote} gu in play 1.5540 entry eu in play 1,2700 entry ..2 bar reversal set up 10 min stops 20 pip each to starts , gu moved up already to be gu maybe t01 40 pip , t02 1.5600 eu 1,2750 not going for big targets {image}
Ignored
SimpleDev,
i have read already hundreds of Mals posts but there is something i can not figure out with his entries, which is missing and not clicking in my head. For example on this chart, the stopping volume candle. He open a long position and does not wait for NS or test .
So, i have rarely seen traditional vsa setups on his posts though he advocates for VSA. Reading bacground has number one importance. Have you understand how his decision process is ? I ask this because his entries are not as common VSA entries as Intels and Hidden Gaps.
b the way, i have seen your post in the thread from 2010. Do you think market makers have realised that retail traders have starting using VSA and MM is trying now to hide their foot prints in some way so it is now more difficult to apply VSA ? I remember DR. Geppynius was talking about this.
{quote} Okay, revealing a trading secret. Sorry for using your pic fex Volume aside, if you see this in an uptrend and better yet if you see this at some of your s/r area, then this is most probably continuation. Long it is. {image}
Ignored
quick question what is the name of the indicator on the bottom right? with the other timeframes.
Going into the long side of that trade you would have to know that it was a counter trend trade and to get out at the first sign of weakness.
Ignored