{quote} oh. i have low level confidence too coz formed not 3-3-3-3-3
Ignored
Yes, it was 3-3-3-3-3... You can't look at a chart and just use the major swing highs and lows... There were some intermediate deep Wave b of Wave iii's in that.
No I haven't got the wave structure wrong! I've corrected it!
{quote} Looks like my first estimate above was right... Wave [a] seen and now a pullback in Wave [ b ]
Ignored
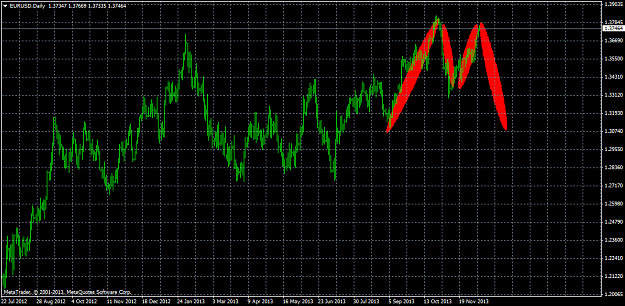
The direct rally is more indicative that the high is imminent.
It could either in place now or will by around 1.3800-10 to complete Wave [c] / [v]. The 1.3800-10 area is the 50% projection in Wave [v].
Expect a correction lower. I'll be using USDCHF as a proxy to determine the likely stalling area since USDCHF will see a Wave [iv] which is simpler to identify.
No I haven't got the wave structure wrong! I've corrected it!
{quote} The direct rally is more indicative that the high is imminent. It could either in place now or will by around 1.3800-10 to complete Wave [c] / [v]. The 1.3800-10 area is the 50% projection in Wave [v]. Expect a correction lower. I'll be using USDCHF as a proxy to determine the likely stalling area since USDCHF will see a Wave [iv] which is simpler to identify.
Ignored
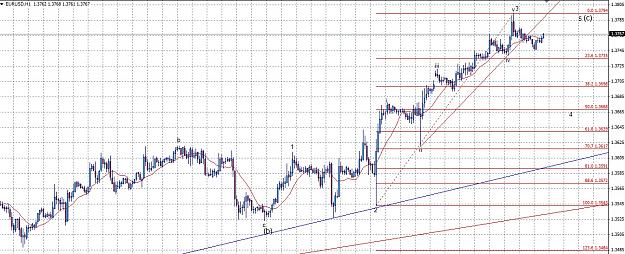
Sorry Ian , but I think that will follow a correction . Target 1,3670 . The maximum is possible to be 1,3794 - wave-5 failed ( in CEW ) .
{quote} Sorry Ian , but I think that will follow a correction . Target 1,3670 . The maximum is possible to be 1,3794 - wave-5 failed ( in CEW ) . {image}
Ignored
Oh, I thought you were bearish from 1.3626...
How come you've changed your wave count so many times?
No I haven't got the wave structure wrong! I've corrected it!
that possibly a big A in daily if stopped at that price. it did not meet expectation of C terminal impulse
im confused too, to count it the fifth segment from 3524/23/25
not meeting a wave 2 coz retrace more than wave 1 start. overlap 362x top at nfp. gap lost wave at 3748. and a wedge before 379x.
if C wave terminal, it should minimal at 3850
but that downward move conclude the e wave top (3832) of expanding triangle. c small (3830-3295) then C terminal should be minimum 3850.
if this is A big (5 wave) then it should retrace as zigzag requirement rite?
if this a wave iii. why its touching 362x at nfp low..
hmmmm
that possibly a big A in daily if stopped at that price. it did not meet expectation of C terminal impulse im confused too, to count it the fifth segment from 3524/23/25 not meeting a wave 2 coz retrace more than wave 1 start. overlap 362x top at nfp. gap lost wave at 3748. and a wedge before 379x. if C wave terminal, it should minimal at 3850 but that downward move conclude the e wave top (3832) of expanding triangle. c small (3830-3295) then C terminal should be minimum 3850. if this is A big (5 wave) then it should retrace as zigzag requirement...
Ignored
im using line angle as mr iwavetrade sugested. its 3rd segment up completed from 3525,
that possibly a big A in daily if stopped at that price. it did not meet expectation of C terminal impulse im confused too, to count it the fifth segment from 3524/23/25 not meeting a wave 2 coz retrace more than wave 1 start. overlap 362x top at nfp. gap lost wave at 3748. and a wedge before 379x. if C wave terminal, it should minimal at 3850 but that downward move conclude the e wave top (3832) of expanding triangle. c small (3830-3295) then C terminal should be minimum 3850. if this is A big (5 wave) then it should retrace as zigzag requirement...
Ignored
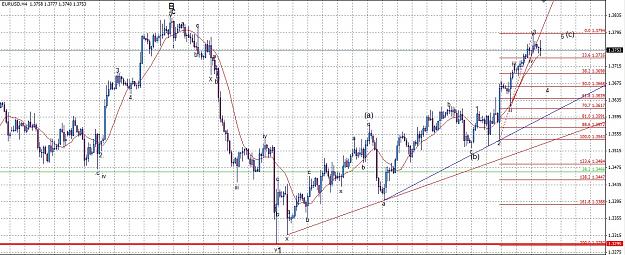
wave (a) - triple zigzag
wave (b) - flat with strong wave-b and failed wave-c
wave (c) - possible failed wave-5(?)
{quote} I adapted from the market - post 6374, if you wait for the market to do what you want, you lose.
Ignored
It's even better if you can spot that it's an impulsive structure and not corrective... However, we can talk about that next month when it gets above 1.3832.
No I haven't got the wave structure wrong! I've corrected it!
{quote} It's even better if you can spot that it's an impulsive structure and not corrective... However, we can talk about that next month when it gets above 1.3832.