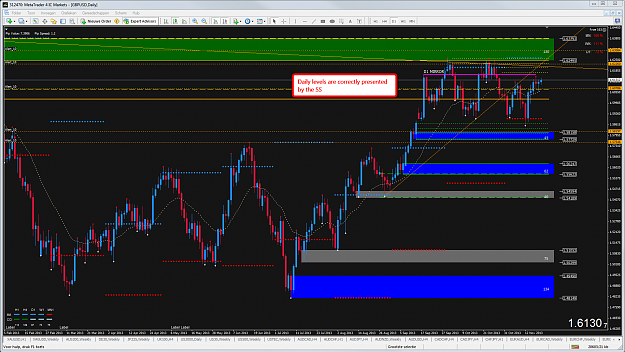
• Home
  • Forums
  • Trades
  • News
  • Calendar
  • Market
  • Brokers
  • Login
  • Join
  • User/Email: Password:
  • 5:39am
Menu
  • Forums
  • Trades
  • News
  • Calendar
  • Market
  • Brokers
  • Login
  • Join
  • 5:39am
Sister Sites
  • Metals Mine
  • Energy EXCH
  • Crypto Craft

Options

Bookmark Thread

First Page First Unread Last Page Last Post

Print Thread

Similar Threads

Firehorse's trading spreadsheet 45 replies

Important Levels Spreadsheet 0 replies

Spreadsheet with RSI and IFISH formulas 0 replies

VWB - Average Range Spreadsheet 6 replies

Does anyone have Daily range spreadsheet? 2 replies

  • Commercial Content
  • /
  • Reply to Thread
  • Subscribe
  • 56
Attachments: Supply and demand daily and weekly levels spreadsheet
Exit Attachments
Tags: Supply and demand daily and weekly levels spreadsheet
Cancel

Supply and demand daily and weekly levels spreadsheet

  • Last Post
  •  
  • 1 67Page 8910 11
  • 1 7Page 89 11
  •  
  • Post #141
  • Quote
  • Nov 19, 2013 11:32am Nov 19, 2013 11:32am
  •  aprilnparker
  • | Joined Oct 2012 | Status: Member | 48 Posts
Quoting MadCow
Disliked
Just so you all know. The 'Update Zones' macro works as follows: Gets the symbol in the first column Reads the ...expertsfilesSD levels.csv file to find the symbol that matches the symbol in the row Gets the proximal line data from the file Fills in the cells that use this data, e.g. cell(5,7) uses the daily proximal supply line. It repeats that operation for every symbol in the first column. That is all that it does. It should not cause the price columns to update. This macro requires that you have enabled macro's for this spreadsheet. It may require...
Ignored


Hi Madcow,

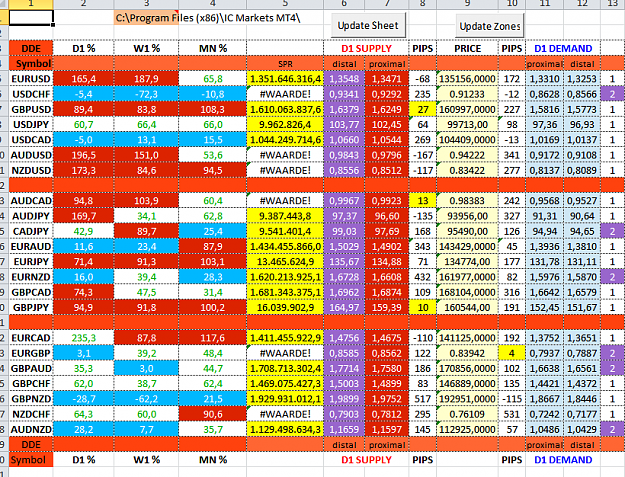
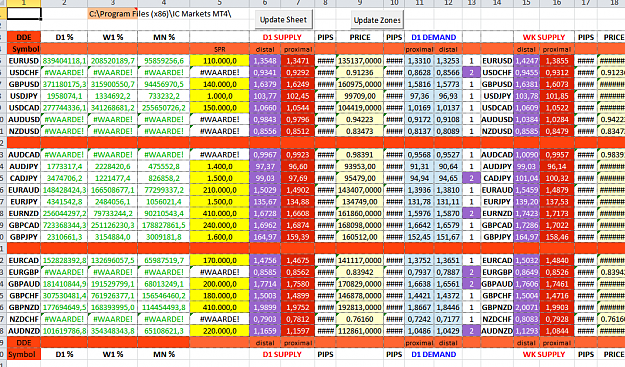
Something weird is happening now with the spreadsheet. I think this is my fault though for customizing it a little bit without knowing all the calculations involved in the spreadsheet. I hope you can give me some advice about this one.

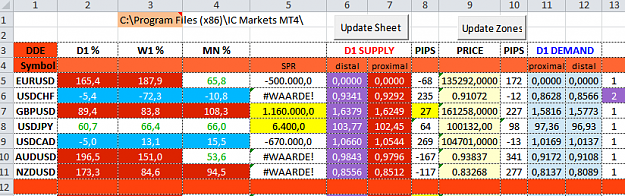
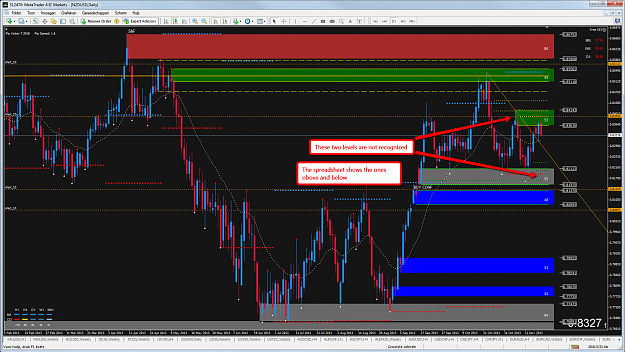
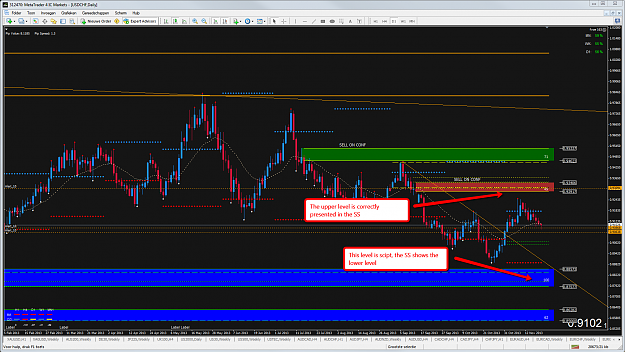
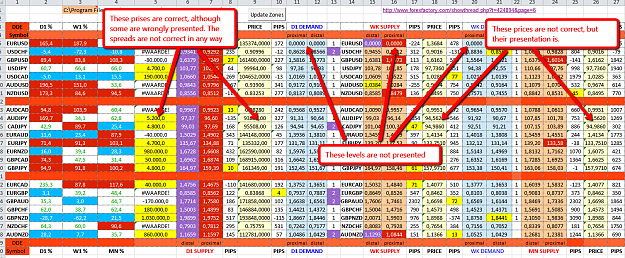
=> The spreadsheet is great and was working for me until for some reason now it only pulls the proximal lines for supply and the distal lines for demand. It inputs the same proximal number in both distal an proximal cells for supply and the same distal number in both the distal and proximal cells in the demand. I can't even think as to why it is pulling some numbers and not the others. I think it is confused.

April
 
 
  • Post #142
  • Quote
  • Nov 19, 2013 11:33am Nov 19, 2013 11:33am
  •  aprilnparker
  • | Joined Oct 2012 | Status: Member | 48 Posts
Quoting Reacto
Disliked
Hi MadCow, first of all a big tanks for this great tool. I followed the instructions in the thread and on page 1 of the spreadsheet. Every step was without any warning or error. Still I need some help, because the file looks like this, with the right levels, but look at the prices and the spread. When I hit F9 or turn on automatic calculations, I get the second picture. I'm using Win 7 and Excel 2010. The only thing I had to do in order to keep the macro's, was to save it as an xlsm-format I really hope you can help me out here. (It looks...
Ignored
Hi Reacto,

If you can't upload the pictures can you describe what you are seeing?

Thanks
April
 
 
  • Post #143
  • Quote
  • Nov 20, 2013 3:13am Nov 20, 2013 3:13am
  •  Reacto
  • | Joined Nov 2010 | Status: Member | 110 Posts
Quoting aprilnparker
Disliked
{quote} Hi Reacto, If you can't upload the pictures can you describe what you are seeing? Thanks April
Ignored

Hi April, I'll give it another try.
Have been playing around with the file yesterday, and found aout that as long as I use just the update buttons the file looks OK.
First picture is after installing/starting the program, second one is after hitting F9 or turning on "automatic" in Excel.
In both cases the spreads are not correct, and the first price column is not correct too, strangely the other two are correct
I have to check on the levels to see if they are correct, let you know in another post.
Attached Image(s) (click to enlarge)
Click to Enlarge

Name: Auto_spreadsheet_after_installation_and_update.png
Size: 130 KB
Click to Enlarge

Name: Auto_spreadsheet_after_hitting_F9.png
Size: 155 KB
 
 
  • Post #144
  • Quote
  • Nov 20, 2013 3:45am Nov 20, 2013 3:45am
  •  Reacto
  • | Joined Nov 2010 | Status: Member | 110 Posts
Hi Madcow,

I would really like this spreadsheet to work, and it looks like it does, but I found some irregularities in D1 levels as you can see below. The strange things that some are correct, and others are not.
I've applied the script, and updated the levels in the SS afterwards by using the "Update Zones" button, and just to be sure the "Update Sheet" button as well.
I will check more levels in D1 and other TF's well, and let you know the results.
Attached Image(s) (click to enlarge)
Click to Enlarge

Name: Auto_SS_levels_vs_charts.png
Size: 46 KB
Click to Enlarge

Name: Auto_spreadsheet_correct_D1_levels_01.png
Size: 112 KB
Click to Enlarge

Name: Auto_spreadsheet_misses_nearest_D1_levels_01.png
Size: 137 KB
Click to Enlarge

Name: Auto_spreadsheet_misses_nearest_D1_levels_02.png
Size: 123 KB
 
 
  • Post #145
  • Quote
  • Edited 4:59am Nov 20, 2013 4:06am | Edited 4:59am
  •  Reacto
  • | Joined Nov 2010 | Status: Member | 110 Posts
Hi Madcow,

I'ts clear I have several problems in the spreadsheet, as shown above, and below. I read that April's spreadsheet worked fine initially, so I would like mine to do the same, but so far it's not. Can you help me out here. ( I have made no adjustments to the sheet). I noticed the indication of the columns has been changed from letters to numbers. Unless I'm mistaking, this wasn't like that before, could this have anything to do with it? I'm asking because the same change happend on an other file that was open, and formulas on that file were no longer correct.
Attached Image (click to enlarge)
Click to Enlarge

Name: Auto_SS_flaws_01.png
Size: 274 KB
 
 
  • Post #146
  • Quote
  • Nov 20, 2013 10:37am Nov 20, 2013 10:37am
  •  Reacto
  • | Joined Nov 2010 | Status: Member | 110 Posts
Hi MadCow,

Just to let you know, when I retrieve the account statement from MT4, and convert it to a xls-file,I have the same problems as I have in the file you made. I have numbers 100,000 times as big as they should be, and others in the same column are correct. Some numbers are really numbers, but others are actually text.
So to me, as non-programmer, it looks like this is MT4 coughing up inconsistent data.
I also opened the file in Open Office, it looked better, layout wise, but the numbers/text were the same.
 
 
  • Post #147
  • Quote
  • Nov 20, 2013 2:00pm Nov 20, 2013 2:00pm
  •  MadCow
  • | Joined Jan 2009 | Status: Member | 109 Posts
Quoting Reacto
Disliked
Hi MadCow, Just to let you know, when I retrieve the account statement from MT4, and convert it to a xls-file,I have the same problems as I have in the file you made. I have numbers 100,000 times as big as they should be, and others in the same column are correct. Some numbers are really numbers, but others are actually text. So to me, as non-programmer, it looks like this is MT4 coughing up inconsistent data. I also opened the file in Open Office, it looked better, layout wise, but the numbers/text were the same.
Ignored

Hi Reacto
Please post your copy of the spreadsheet (xlsm) here so that I can look at the individual cell formulas. Perhaps you can post the SD Levels.csv file as well.
Hi April
If you post the same info I will try to help.
MadCow
 
 
  • Post #148
  • Quote
  • Nov 21, 2013 12:42am Nov 21, 2013 12:42am
  •  aprilnparker
  • | Joined Oct 2012 | Status: Member | 48 Posts
Quoting MadCow
Disliked
{quote} Hi Reacto Please post your copy of the spreadsheet (xlsm) here so that I can look at the individual cell formulas. Perhaps you can post the SD Levels.csv file as well. Hi April If you post the same info I will try to help. MadCow
Ignored
Thanks Madcow,

Attached is the spreadsheet and .csv file. I made some small modifications on it. I am only working with H4/Weekly Combo so I hide the daily and monthly percentages and the distal and proximal lines are empty for them. I only have data for the Weekly. Let me know what you think. I appreciate all your hard work.

Thanks You
April
Attached File(s)
File Type: csv SD levels.csv   5 KB | 285 downloads
File Type: zip Supply_Demand_ Curve_Total Auto.zip   175 KB | 369 downloads
 
 
  • Post #149
  • Quote
  • Nov 21, 2013 12:51am Nov 21, 2013 12:51am
  •  aprilnparker
  • | Joined Oct 2012 | Status: Member | 48 Posts
Quoting Reacto
Disliked
Hi Madcow, I'ts clear I have several problems in the spreadsheet, as shown above, and below. I read that April's spreadsheet worked fine initially, so I would like mine to do the same, but so far it's not. Can you help me out here. ( I have made no adjustments to the sheet). I noticed the indication of the columns has been changed from letters to numbers. Unless I'm mistaking, this wasn't like that before, could this have anything to do with it? I'm asking because the same change happend on an other file that was open, and formulas on that file...
Ignored
Hi Reacto,

Can you upload a screenshot selecting a spread cell showing the formula inside? For instance. EurUsd spread cell should be =(MT4|ASK!EURUSD-RC[4])*10000 and for any pair with the JPY it is =(MT4|ASK!USDJPY-RC[4])*100 You change the pair in the formula.

Each Price cell for the each pair should be =MT4|BID!EURUSD except change Eurusd to the pair you are pulling the price from (=MT4|BID!USDJPY; =MT4|BID!AUDUSD; etc.)

as far as the distal and proximal lines, I am having the same issue with some displaying the right levels while others are not.
 
 
  • Post #150
  • Quote
  • Nov 21, 2013 2:17am Nov 21, 2013 2:17am
  •  Reacto
  • | Joined Nov 2010 | Status: Member | 110 Posts
Quoting aprilnparker
Disliked
{quote} Thanks Madcow, Attached is the spreadsheet and .csv file. I made some small modifications on it. I am only working with H4/Weekly Combo so I hide the daily and monthly percentages and the distal and proximal lines are empty for them. I only have data for the Weekly. Let me know what you think. I appreciate all your hard work. Thanks You April {file} {file}
Ignored
Hi Madcow,

Here are the files.
Just a thought: Since Open Office is working well with regard to importing prices and spread, and your indicator and dll are capable of retrieving the levels, wouldn't it be less sensitive for problems like these to have the spreadsheet in Open Office?
Attached File(s)
File Type: csv SD levels.csv   7 KB | 254 downloads
File Type: rar Supply_Demand_ Auto_Robert.rar   232 KB | 351 downloads
 
 
  • Post #151
  • Quote
  • Nov 21, 2013 2:21am Nov 21, 2013 2:21am
  •  Reacto
  • | Joined Nov 2010 | Status: Member | 110 Posts
Quoting Reacto
Disliked
{quote} Hi Madcow, Here are the files. Just a thought: Since Open Office is working well with regard to importing prices and spread, and your indicator and dll are capable of retrieving the levels, wouldn't it be less sensitive for problems like these to have the spreadsheet in Open Office? {file} {file}
Ignored

Hi April,

Better jet, I've uploaded the file in the post above
 
 
  • Post #152
  • Quote
  • Nov 21, 2013 4:50am Nov 21, 2013 4:50am
  •  Reacto
  • | Joined Nov 2010 | Status: Member | 110 Posts
Hi MadCow and April,

See post 145.
I checked the file that was open at the same time I tried the Auto SS against a copy of that file in my back-up. That file had nothing to do with MT4, or any macro, but some of the formulas were changed in that file after I had used the Auto SS.

Regrettably, this seems like quit a severe bug to me
 
 
  • Post #153
  • Quote
  • Nov 21, 2013 9:25am Nov 21, 2013 9:25am
  •  Reacto
  • | Joined Nov 2010 | Status: Member | 110 Posts
Hi MadCow and April

I understand that requests for changes can cause a lot of work. Having said that,I would like to make a proposal for a small change (at least I hope it's a small change), and that is to insert two or three columns to allow for the higher TF-direction to be combined with the hight in the curve as the SS is showing. This way we would have direction on higher TF's and hight in the curve end broken levels all in one view, like the picture below.
Attached Image (click to enlarge)
Click to Enlarge

Name: Proposal_on_auto_SS.png
Size: 32 KB
 
 
  • Post #154
  • Quote
  • Nov 21, 2013 12:34pm Nov 21, 2013 12:34pm
  •  aprilnparker
  • | Joined Oct 2012 | Status: Member | 48 Posts
Quoting Reacto
Disliked
Hi MadCow and April I understand that requests for changes can cause a lot of work. Having said that,I would like to make a proposal for a small change (at least I hope it's a small change), and that is to insert two or three columns to allow for the higher TF-direction to be combined with the hight in the curve as the SS is showing. This way we would have direction on higher TF's and hight in the curve end broken levels all in one view, like the picture below. {image}
Ignored

Hi Reacto,

What a great idea. If you input the data manually, it shouldn't be a problem. However, if you insert new cells it may affect the formulas in other cells. Be better to add then underneath the percentages columns as to not play around with modifying calculations? I will try this.

I will look at your spreadsheet shortly, from what it sounds like, the calculations got all mixed up.

April
 
 
  • Post #155
  • Quote
  • Nov 21, 2013 12:38pm Nov 21, 2013 12:38pm
  •  aprilnparker
  • | Joined Oct 2012 | Status: Member | 48 Posts
Quoting Reacto
Disliked
{quote} Hi Madcow, Here are the files. Just a thought: Since Open Office is working well with regard to importing prices and spread, and your indicator and dll are capable of retrieving the levels, wouldn't it be less sensitive for problems like these to have the spreadsheet in Open Office? {file} {file}
Ignored

Reacto,

Can you upload your spreadsheet as a .zip file instead? Windows 7 has a build-in "zipper" You should be able to right-click on the file and select "Send to" and the option "Compressed Zip File". I am not able to download the Winrar software on my work system. I would have to look at your spreadsheet tonight when I get home unless you can upload a zip file.

Thanks
April
 
 
  • Post #156
  • Quote
  • Edited 6:55pm Nov 21, 2013 6:45pm | Edited 6:55pm
  •  MadCow
  • | Joined Jan 2009 | Status: Member | 109 Posts
Quoting Reacto
Disliked
{quote} Hi Madcow, Here are the files. Just a thought: Since Open Office is working well with regard to importing prices and spread, and your indicator and dll are capable of retrieving the levels, wouldn't it be less sensitive for problems like these to have the spreadsheet in Open Office? {file} {file}
Ignored

Hi Reacto,
It might be that open office is a better solution, though I am not sure if anyone has tested it retrieving data from MT4 in Win 8. Joe uses Vista. Don't know about Alfonso. My problem is that there is no simple way to translate Excel macros to OO macros. To write the macro in OO I would have to learn a new language, and I am reluctant to spend the time when Excel works just fine.

There are several possible problems with your set up.
1. You may not have turned on the DDE server in your metatrader. Use 'tools/options/server' to turn on DDE.
2. You are operating with the metatrader in the program files folder in Win 8. If this is the case you need to either move the terminal outside the program files, or take steps to inform Win 8 that it is OK for a DDE server to send/recieve messages from within the program files directory. I don't know how to do the latter, so I have done the former. Perhaps April or someone more familiar with Win 8 can help here.
3. You may not have enabled the spreadsheet to use external links. Use the Excel Options panel to do this.
4. You have changed to xlsm from xls. I know that is what Excel suggests, but I do not know how Win 8 and xlsm interact. I know that the xls file works fine with Win XP. (xlsm is supposedly just xlsx with macros enabled, but I bet there are other subtle differences).

While I agree that Metatrader is difficult to deal with sometimes, I don't think it is giving bad info, I think it is we mortals that are interpreting the data incorrectly. I have never had any trouble exporting account data from Metatrader. If you right click the account window you can save as report or as detailed report. That will be an htm file that you can export directly into excel. All the numbers will be correct.

As to spreadsheet modifications. I derived this spreadsheet by using OO to export the ods spreadsheet as an xls sheet. So the sheet is exactly as Joe originally made it. I have no reason to change it. If you and April see a way to make things better, please do so and post the result. I will modify the macros to match the sheet. If you need some help programming a modified sheet, I will try to help there too, but I am not an Excel expert, so make the mods simple. Hopefully we need do this only once, so be careful that you ask for the whole pie.

MadCow
 
 
  • Post #157
  • Quote
  • Nov 21, 2013 6:52pm Nov 21, 2013 6:52pm
  •  MadCow
  • | Joined Jan 2009 | Status: Member | 109 Posts
Quoting Reacto
Disliked
Hi MadCow and April I understand that requests for changes can cause a lot of work. Having said that,I would like to make a proposal for a small change (at least I hope it's a small change), and that is to insert two or three columns to allow for the higher TF-direction to be combined with the hight in the curve as the SS is showing. This way we would have direction on higher TF's and hight in the curve end broken levels all in one view, like the picture below. {image}
Ignored

Hi again,
Where will the data on the higher TF direction come from? I have never seen this from Rectangle Reader, or any other indicator that we use. I think you will have to provide that data manually. If you do that, what is the use of automating the spreadsheet?

On second thought, if you draw trend lines on the HTF charts to show direction, it might be possible to modify a couple of indicators to capture the slope of the trend line and export it to the SD_levels file. A lot of work, but if there is reason enough (enough people want it, or convince me that it is useful) I will spend some time on it.

MadCow
 
 
  • Post #158
  • Quote
  • Nov 21, 2013 7:14pm Nov 21, 2013 7:14pm
  •  aprilnparker
  • | Joined Oct 2012 | Status: Member | 48 Posts
Quoting MadCow
Disliked
{quote} Hi Reacto, It might be that open office is a better solution, though I am not sure if anyone has tested it retrieving data from MT4 in Win 8. Joe uses Vista. Don't know about Alfonso. My problem is that there is no simple way to translate Excel macros to OO macros. To write the macro in OO I would have to learn a new language, and I am reluctant to spend the time when Excel works just fine. There are several possible problems with your set up. 1. You may not have turned on the DDE server in your metatrader. Use 'tools/options/server' to...
Ignored

Thanks Madcow for the response. I know why mine wasn't working. I deleted several columns that I would not like to see on my spreadsheet but this messed up where the distal and proximal lines were painted. I restored the sheet back to the original one you posted and everything is working. Distal and Proximal lines pull and display correctly now. No errors.

April
 
 
  • Post #159
  • Quote
  • Nov 21, 2013 7:24pm Nov 21, 2013 7:24pm
  •  aprilnparker
  • | Joined Oct 2012 | Status: Member | 48 Posts
Quoting aprilnparker
Disliked
{quote} Thanks Madcow for the response. I know why mine wasn't working. I deleted several columns that I would not like to see on my spreadsheet but this messed up where the distal and proximal lines were painted. I restored the sheet back to the original one you posted and everything is working. Distal and Proximal lines pull and display correctly now. No errors. April
Ignored
Instead of deleting columns I am just hiding them now. That doesn't seem to mess up the calculations and indicator pull.
 
 
  • Post #160
  • Quote
  • Nov 21, 2013 7:25pm Nov 21, 2013 7:25pm
  •  aprilnparker
  • | Joined Oct 2012 | Status: Member | 48 Posts
Quoting MadCow
Disliked
{quote} Hi again, Where will the data on the higher TF direction come from? I have never seen this from Rectangle Reader, or any other indicator that we use. I think you will have to provide that data manually. If you do that, what is the use of automating the spreadsheet? On second thought, if you draw trend lines on the HTF charts to show direction, it might be possible to modify a couple of indicators to capture the slope of the trend line and export it to the SD_levels file. A lot of work, but if there is reason enough (enough people want it,...
Ignored

I would be interesting! How cool would that be to tell us the direction of the trend automatically...omg!
 
 
  • Commercial Content
  • /
  • Supply and demand daily and weekly levels spreadsheet
  • Reply to Thread
    • 1 67Page 8910 11
    • 1 7Page 89 11
0 traders viewing now
  • More
Top of Page
  • Facebook
  • Twitter
About FF
  • Mission
  • Products
  • User Guide
  • Media Kit
  • Blog
  • Contact
FF Products
  • Forums
  • Trades
  • Calendar
  • News
  • Market
  • Brokers
  • Trade Explorer
FF Website
  • Homepage
  • Search
  • Members
  • Report a Bug
Follow FF
  • Facebook
  • Twitter

FF Sister Sites:

  • Metals Mine
  • Energy EXCH
  • Crypto Craft

Forex Factory® is a brand of Fair Economy, Inc.

Terms of Service / ©2023