I do not post very often at ForexFactory, nor have I started many threads. However, today there is a need for a new thread to discuss and test what I believe is a technically very sound and worthwhile trading system. It's more than a system really...it's a paradigm shift in and of itself where Reward/Risk and trade management are concerned. It is called the 10XROI System and it was first introduced by another ForexFactory member just a few days ago who, unfortunately, must remain nameless and is unable to post here due to commercial restrictions. He is very generous for freely sharing this system with the community.
Recently, I have been in search of some missing components to my own trading. Having long since settled the issues of proper money management parameters within the last 3 years or so, I am still in need of specific tactics that will advance my overall high R/R money management strategy. I am firmly convinced that the best R/R opportunities come when setups are identified on a higher TF and the entries occur on a lower TF. Doing this puts your trades into a naturally high R/R structure by design. Tight stops on low TF combined with higher TF targets is, IMHO, the way to go. If that approach fits your trading style and money management profile, then this system will be worth your time. If it does not appeal to you, then I invite you to consider taking a look anyway and possibly changing your paradigms about money management and high R/R systems. I think you will be quite challenged in your current thinking if you do.
Ok, let's outline the thread purpose and system rules as clearly as possible.
PURPOSE OF THREAD:
The goals I have in mind for this thread are, firstly, to provide a place for those interested in trading this method to collaborate, post trade setups/entries, and learn the method correctly as presented from the outset. In order for that to happen, we must firmly resist all attempts and temptations to "tweak" the method until we have empirically proven a need exists for some specific adjustment. "Tweakitis" is probably the most fatal disease known to trading system forum threads. If anyone starts suggesting that we add this or that new indicator or that we alter any system rules BEFORE they have bothered to do substantial testing, then you will be asked to leave. If you have a suggestion for improvement, post it WITH SUPPORTING DATA, or don't post. Adjustments to any system SHOULD NOT happen until sufficient testing has occured FIRST. If you whimsically alter the rules of a system on the fly in the absence of DATA that indicates the change is necessary, then you are trading ANOTHER system. We are NOT going to fall into that juvenile trap. We will avoid and strongly resist this time-wasting, money-draining activity and do proper testing according to the rules laid out for the system. Please respect these directives for the good of all who participate. Don't become a distraction from the goals. 'Nuff said...
Secondly, we will seek to engage in both forward and backward testing. This system should backtest nicely on ForexTester2 and/or Vhands. I personally prefer FXT2 and will be using it myself. I will also be doing forward testing with very low live leverage. Demo testing on cyber money is definitely advisable until you:
1. Learn the rules
2. Have sufficiently demonstrated you can execute the rules consistently
3. Have decided the system fits your trading style and needs
SYSTEM OVERVIEW:
We are seeking to identify a particular candle pattern on a D1 chart which must then be qualified by the presence of supporting elements that will provide positive trading context. Properly qualified entries will be taken from the H1 charts. The overall object in trade management will be to obtain a 10R trade, or a trade that yields a reward of 10 times the initial risk amount. Please be advised this system has a specific money and trading management structure which is an integral and foundational part of the system. If you alter or omit the money and trading management, you are NO LONGER TRADING THIS SYSTEM.
THE CORE CANDLE PATTERN:
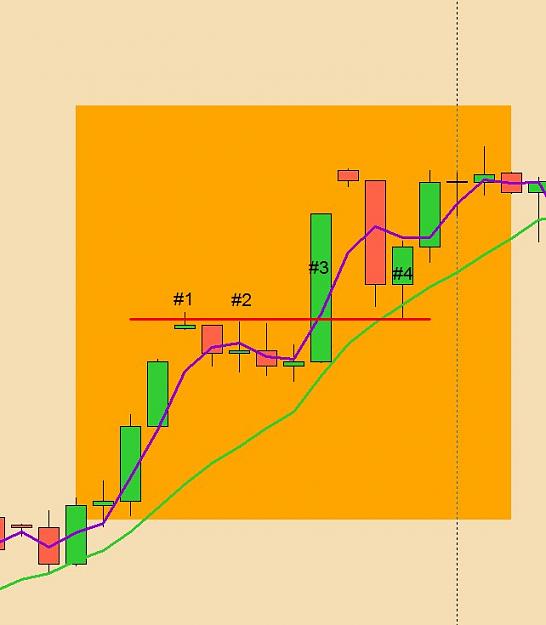
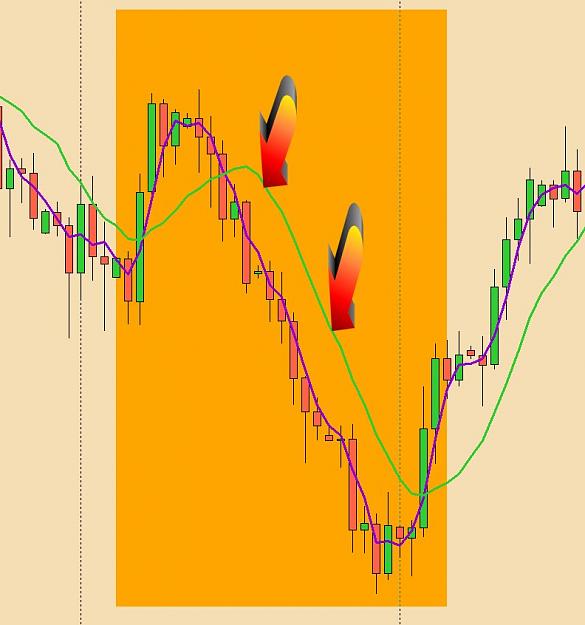
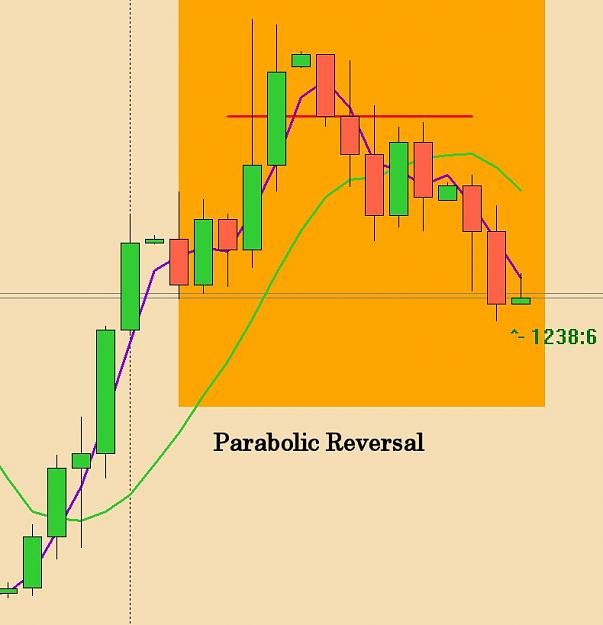
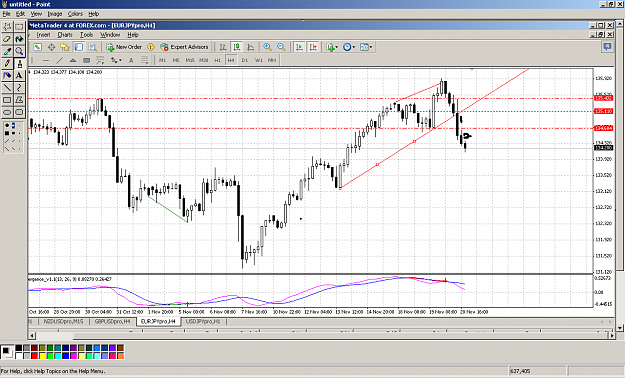
This system focuses on one primary candle pattern. It is called the "Push/Pull" candle pattern. It is only valid when seen on a D1 chart ALONG WITH the presence of certain supporting elements which provide the necessary postive trading context. There are several variations of the pattern and we will identify those specifically as we develop the thread with chart examples. We are looking for the contextual elements of momentum, S/R levels, and price action patterns. These will be discussed further below with examples.
TRADING/CHARTING TOOLS USED:
Charting will be fairly clean with minimal analysis tools applied. There are no indicators, per se, only candles and a couple of simple moving averages. The presence of momentum in the market is identified using a 3 period and 10 period SMA. I will post a template file for convenience if anyone wants to use it. I will also include a fib tool that I have modified to include Entry, Stop, and Target levels from 1R through 10R. This is a money management tool only. You simply place the anchors on your entry price and stop loss price and it will project your R levels from there.
COMMON TERMINOLOGY:
When discussing Reward/Risk, I prefer to use the terminology coined by Van Tharp which speaks of trades and/or profits as being expressed in factors of "R", where "R" represents the initial risk involved on the trade. Thus, if you have a trade with a 10 pip stop and a 20 pip profit target, the trade would be a 2R trade. This system works to secure 10R trades if possible, or gains of 10 times the risk. I think it's the simplest way of expressing "Reward/Risk", "Risk/Reward", "R/R", or whatever variant traders call it. It would be good if we would all adopt that convention in our posts. It's not mandatory, and I don't want to be a forum cop, but I think it will be helpful to our common discourse.
I will add more posts with additional information to further explain the system and give visual examples.
EDIT: I have added two templates to this post. One is for the color scheme I use for the 10XROI system with the MA's already loaded. The second template is a fib archive template that MUST be applied to a EURJPY MONTHLY chart so you can see the fib tool. I have added a fib tool with preset levels and labels to show you profit levels from 1R through 10R. The anchor points are labeled STOP and ENTRY. Once you place the anchors on your SL and Entry prices, you will know exactly where your various R levels of profit are located. To get this fib onto a chart, simply alter its color in the fib properties and it will become your temporary default fib. Then apply the fib to any chart you wish. Do not delete the archive template and you will have a convenient place to store various fibs or other similar tools with preset levels that you don't want to have to rebuild. Always be sure to open this template on EJ Monthly or else the fibs and other objects will be out of the visual price range.
EDIT: 11/24/2013: I have received feedback that I have not explained this method clearly enough. Here is my effort at a more succinct summery, hopefully, with more clarity as well.
10XROI Condensed Version
Recently, I have been in search of some missing components to my own trading. Having long since settled the issues of proper money management parameters within the last 3 years or so, I am still in need of specific tactics that will advance my overall high R/R money management strategy. I am firmly convinced that the best R/R opportunities come when setups are identified on a higher TF and the entries occur on a lower TF. Doing this puts your trades into a naturally high R/R structure by design. Tight stops on low TF combined with higher TF targets is, IMHO, the way to go. If that approach fits your trading style and money management profile, then this system will be worth your time. If it does not appeal to you, then I invite you to consider taking a look anyway and possibly changing your paradigms about money management and high R/R systems. I think you will be quite challenged in your current thinking if you do.
Ok, let's outline the thread purpose and system rules as clearly as possible.
PURPOSE OF THREAD:
The goals I have in mind for this thread are, firstly, to provide a place for those interested in trading this method to collaborate, post trade setups/entries, and learn the method correctly as presented from the outset. In order for that to happen, we must firmly resist all attempts and temptations to "tweak" the method until we have empirically proven a need exists for some specific adjustment. "Tweakitis" is probably the most fatal disease known to trading system forum threads. If anyone starts suggesting that we add this or that new indicator or that we alter any system rules BEFORE they have bothered to do substantial testing, then you will be asked to leave. If you have a suggestion for improvement, post it WITH SUPPORTING DATA, or don't post. Adjustments to any system SHOULD NOT happen until sufficient testing has occured FIRST. If you whimsically alter the rules of a system on the fly in the absence of DATA that indicates the change is necessary, then you are trading ANOTHER system. We are NOT going to fall into that juvenile trap. We will avoid and strongly resist this time-wasting, money-draining activity and do proper testing according to the rules laid out for the system. Please respect these directives for the good of all who participate. Don't become a distraction from the goals. 'Nuff said...
Secondly, we will seek to engage in both forward and backward testing. This system should backtest nicely on ForexTester2 and/or Vhands. I personally prefer FXT2 and will be using it myself. I will also be doing forward testing with very low live leverage. Demo testing on cyber money is definitely advisable until you:
1. Learn the rules
2. Have sufficiently demonstrated you can execute the rules consistently
3. Have decided the system fits your trading style and needs
SYSTEM OVERVIEW:
We are seeking to identify a particular candle pattern on a D1 chart which must then be qualified by the presence of supporting elements that will provide positive trading context. Properly qualified entries will be taken from the H1 charts. The overall object in trade management will be to obtain a 10R trade, or a trade that yields a reward of 10 times the initial risk amount. Please be advised this system has a specific money and trading management structure which is an integral and foundational part of the system. If you alter or omit the money and trading management, you are NO LONGER TRADING THIS SYSTEM.
THE CORE CANDLE PATTERN:
This system focuses on one primary candle pattern. It is called the "Push/Pull" candle pattern. It is only valid when seen on a D1 chart ALONG WITH the presence of certain supporting elements which provide the necessary postive trading context. There are several variations of the pattern and we will identify those specifically as we develop the thread with chart examples. We are looking for the contextual elements of momentum, S/R levels, and price action patterns. These will be discussed further below with examples.
TRADING/CHARTING TOOLS USED:
Charting will be fairly clean with minimal analysis tools applied. There are no indicators, per se, only candles and a couple of simple moving averages. The presence of momentum in the market is identified using a 3 period and 10 period SMA. I will post a template file for convenience if anyone wants to use it. I will also include a fib tool that I have modified to include Entry, Stop, and Target levels from 1R through 10R. This is a money management tool only. You simply place the anchors on your entry price and stop loss price and it will project your R levels from there.
COMMON TERMINOLOGY:
When discussing Reward/Risk, I prefer to use the terminology coined by Van Tharp which speaks of trades and/or profits as being expressed in factors of "R", where "R" represents the initial risk involved on the trade. Thus, if you have a trade with a 10 pip stop and a 20 pip profit target, the trade would be a 2R trade. This system works to secure 10R trades if possible, or gains of 10 times the risk. I think it's the simplest way of expressing "Reward/Risk", "Risk/Reward", "R/R", or whatever variant traders call it. It would be good if we would all adopt that convention in our posts. It's not mandatory, and I don't want to be a forum cop, but I think it will be helpful to our common discourse.
I will add more posts with additional information to further explain the system and give visual examples.
EDIT: I have added two templates to this post. One is for the color scheme I use for the 10XROI system with the MA's already loaded. The second template is a fib archive template that MUST be applied to a EURJPY MONTHLY chart so you can see the fib tool. I have added a fib tool with preset levels and labels to show you profit levels from 1R through 10R. The anchor points are labeled STOP and ENTRY. Once you place the anchors on your SL and Entry prices, you will know exactly where your various R levels of profit are located. To get this fib onto a chart, simply alter its color in the fib properties and it will become your temporary default fib. Then apply the fib to any chart you wish. Do not delete the archive template and you will have a convenient place to store various fibs or other similar tools with preset levels that you don't want to have to rebuild. Always be sure to open this template on EJ Monthly or else the fibs and other objects will be out of the visual price range.
EDIT: 11/24/2013: I have received feedback that I have not explained this method clearly enough. Here is my effort at a more succinct summery, hopefully, with more clarity as well.
10XROI Condensed Version
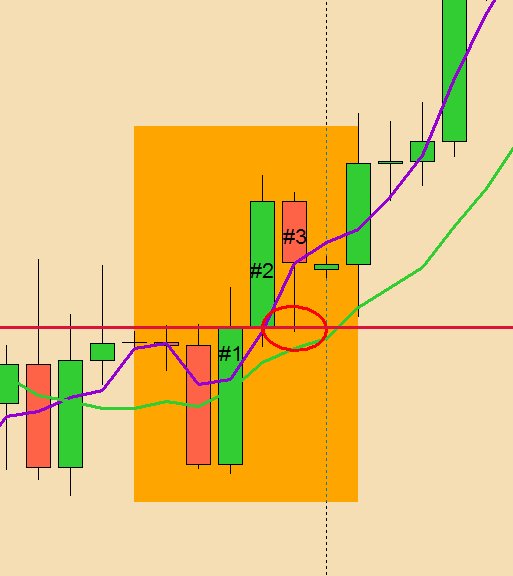
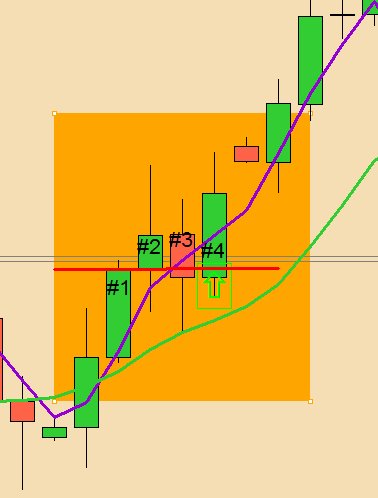
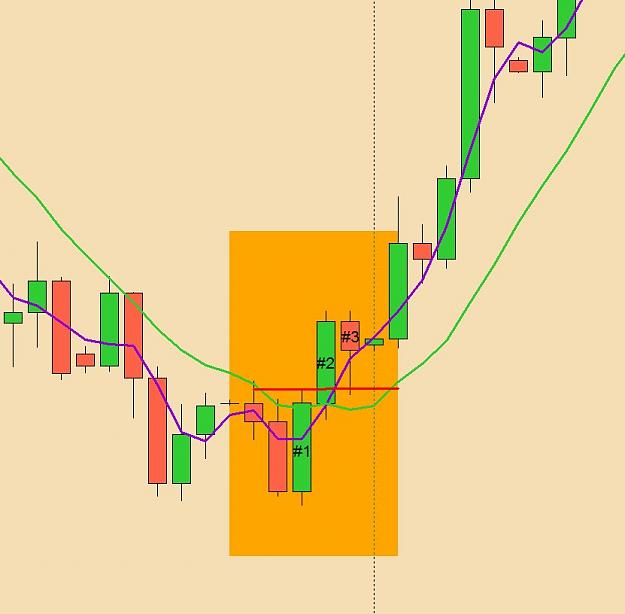
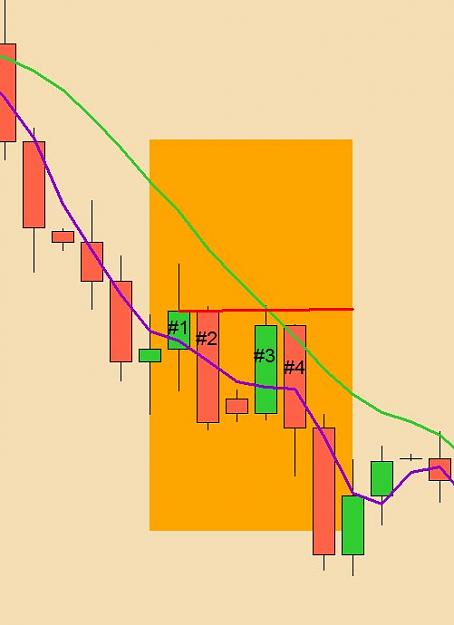
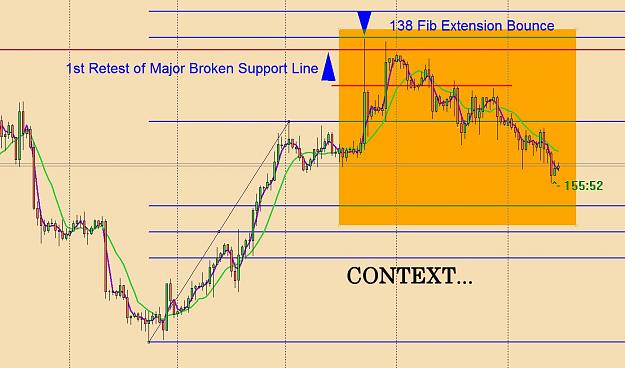
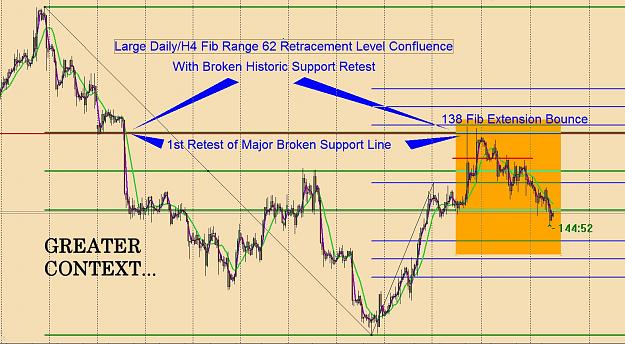
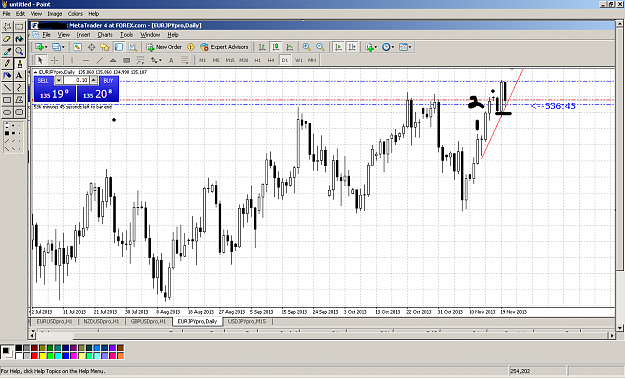
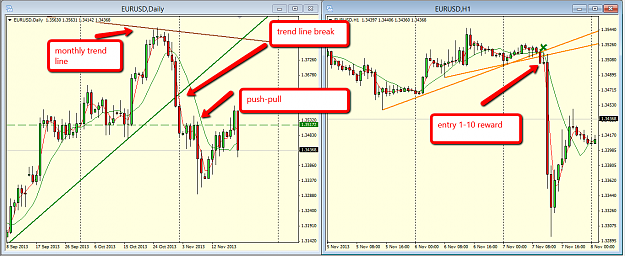
- Setups occur in the form of a "Push/Pull" candle pattern (see examples at beginning of thread) and are found ONLY on the Daily Charts for this system. A condition of STRONG MOMENTUM is a prerequisite and must be identified to validate the candle pattern. The 3SMA and 10SMA's are the primary tools used to identify strong momentum is present for a VALID Push/Pull patter. Additional trade "context" factors are desireable and are described in the first posts.
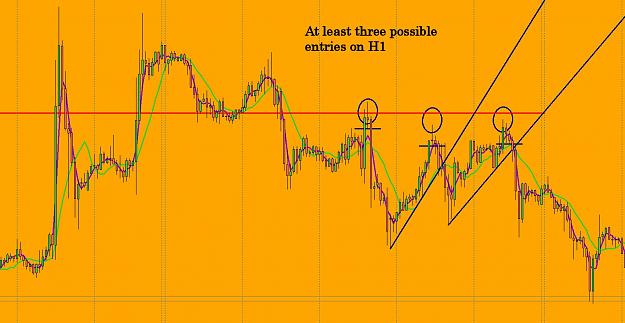
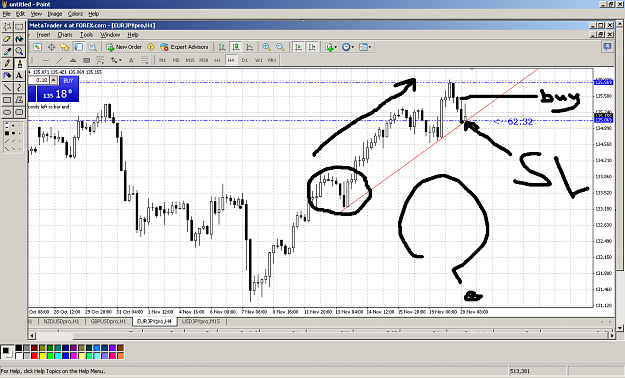
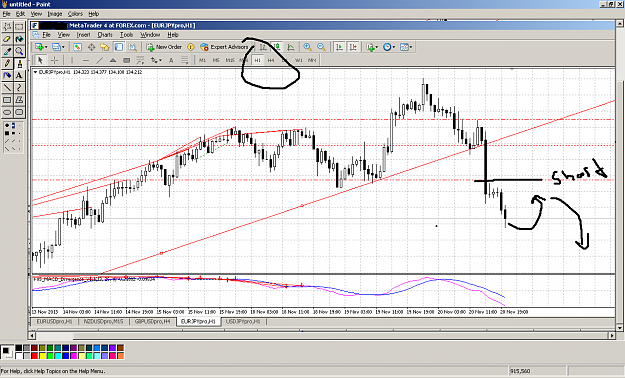
- Once a setup is identified, you will then seek an entry on the H1 chart into the direction of the momentum from the D1 setup. The nature of the Push/Pull candle pattern is that it prompts you to begin looking for an entry ONLY after a PULLBACK has occured against a PUSH of strong momentum. The idea is to get a tight stop H1 entry at a place where price is likely to RESUME it's momentum in the original D1 direction.
- Use whatever technicals you prefer, such as trendilne breaks, pivot candle breaks or whatever entry method of your choice you think will give you a tight stop. Tight stop = 40 pips or less. Keep in mind that you are looking for a 10R return. So, if you have a 40 pip stop, the market will have to move 300 pips in your favor. If your stop is only 15 pips, you will only need a profit of 150 pips. The tighter the stop, the better the chance of success at 10R.
- Once in the trade, do not move your stop to BE until after the first significant hourly pullback. This is a bit subjective, but a proper pullback should be more than just a 3 or 4 candle fractal.
- Your TP should be set at 10 times your initial risk, or a profit factor of 10R.
- If the pair you are trading has a low ADR, then you may want to shoot for 8R instead of 10R.
- Rinse and repeat.
Attached File(s)