GOLD NUGGET #3
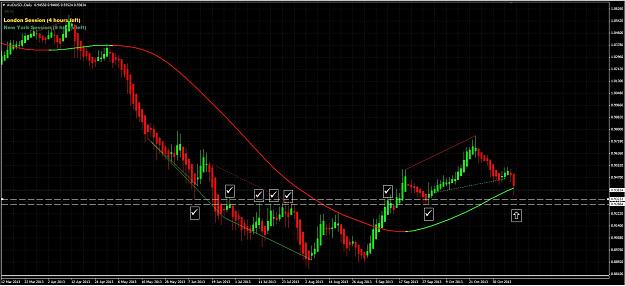
Here is a LIVE example about nugget #3. Like I have said in the last post, if an area is respected on BOTH sides, meaning acting as support and resistance in the past PLEASE remember when it comes into that level the likelyhood of a reaction is VERY high. Especially when you are trading WITH the trend. Having said that I have posted a daily chart of AUDUSD because we are coming into a very strong area on the charts. I am hesitant to post this because I dont want to see someone jumping in just because of this. You MUST have proper confirmation on the lower time frames to take a trade based off this area!!! This is just an area to watch that will VERY likely cause a reaction (bounce) in the market! Why is this level so powerful? Well take a look at where I have all the checkmarks on your chart. This area has been hit over and over and over and price reacted, SO WHEN PRICE COMES INTO THIS LEVEL IT WILL LIKELY CAUSE A REACTION. I have in dotted lines the "area" to watch and the checkmarks that are below price resulted in a bouce and checkmarks above price resulted in a sell off. Can you see the trading opportunity that looks to be the BEST on this chart? It would be the LAST checkmark. Price at that point was WITH THE TREND, making the odds of a BOUNCE off that area much better. You might say, well price was with the trend on the second check mark too. Well, this is true....however at that point there had only been one reaction off of price so thats why you would not take it....and the 2nd, 3rd, and 4th arrows were acting like a jackhammer hitting concrete...they were trying to blast through...usually the FIRST hit after a breakout is best....the second does work many times also..but that is another gold nugget which I will explain in the future. For that reason, because the hit we are coming into will be the 2ND in a row hitting this level from above it is less likely to react like the first one did. Still, a very probably area for a bounce. Happy Trading
Here is a LIVE example about nugget #3. Like I have said in the last post, if an area is respected on BOTH sides, meaning acting as support and resistance in the past PLEASE remember when it comes into that level the likelyhood of a reaction is VERY high. Especially when you are trading WITH the trend. Having said that I have posted a daily chart of AUDUSD because we are coming into a very strong area on the charts. I am hesitant to post this because I dont want to see someone jumping in just because of this. You MUST have proper confirmation on the lower time frames to take a trade based off this area!!! This is just an area to watch that will VERY likely cause a reaction (bounce) in the market! Why is this level so powerful? Well take a look at where I have all the checkmarks on your chart. This area has been hit over and over and over and price reacted, SO WHEN PRICE COMES INTO THIS LEVEL IT WILL LIKELY CAUSE A REACTION. I have in dotted lines the "area" to watch and the checkmarks that are below price resulted in a bouce and checkmarks above price resulted in a sell off. Can you see the trading opportunity that looks to be the BEST on this chart? It would be the LAST checkmark. Price at that point was WITH THE TREND, making the odds of a BOUNCE off that area much better. You might say, well price was with the trend on the second check mark too. Well, this is true....however at that point there had only been one reaction off of price so thats why you would not take it....and the 2nd, 3rd, and 4th arrows were acting like a jackhammer hitting concrete...they were trying to blast through...usually the FIRST hit after a breakout is best....the second does work many times also..but that is another gold nugget which I will explain in the future. For that reason, because the hit we are coming into will be the 2ND in a row hitting this level from above it is less likely to react like the first one did. Still, a very probably area for a bounce. Happy Trading
Attached Image (click to enlarge)