• Home
  • Forums
  • Trades
  • News
  • Calendar
  • Market
  • Brokers
  • Login
  • Join
  • User/Email: Password:
  • 5:07am
Menu
  • Forums
  • Trades
  • News
  • Calendar
  • Market
  • Brokers
  • Login
  • Join
  • 5:07am
Sister Sites
  • Metals Mine
  • Energy EXCH
  • Crypto Craft

Options

Bookmark Thread

First Page First Unread Last Page Last Post

Print Thread

Similar Threads

Price movement as a function of Supply and Demand 43 replies

Supply and demand zones and EW principles 1 reply

How Markets Work, in a Nutshell! 32 replies

Supply and Demand Zones 43 replies

Demand and Supply 1 reply

  • Commercial Content
  • /
  • Reply to Thread
  • Subscribe
  • 5,247
Attachments: Supply and demand in a nutshell by Alfonso Moreno
Exit Attachments

Supply and demand in a nutshell by Alfonso Moreno

  • Last Post
  •  
  • 1 100101Page 102103104 486
  • 1 Page 102 486
  •  
  • Post #2,021
  • Quote
  • Sep 5, 2013 10:21am Sep 5, 2013 10:21am
  •  Axlz
  • | Joined Jul 2013 | Status: Member | 431 Posts
Excellent webinar once again. Huge thanks to Alfonso for taking the time to hold these!
 
 
  • Post #2,022
  • Quote
  • Sep 5, 2013 10:40am Sep 5, 2013 10:40am
  •  panoramia
  • | Commercial Member | Joined Aug 2011 | 3,525 Posts
Quoting rtb
Disliked
I loaded the rectangle reader indicator and all time frames are enabled but I don't see any difference? {image}
Ignored
Well, you dont' see any differences for ONE single reason. The rectangle reader indicator does NOT affect automatic rectangles. You need to draw the rectangles manually with MT's rectangle tool, and THEN the rectangle indicator will extend the indicator and add labels, pips, trendlines, etc.

Threre are 2 whole 1 hour videos talking about it, you should watch them and learn what it does, otherwise it will be useless for you.

The rectangle reader indicator thread is this one. http://www.forexfactory.com/showthread.php?t=428268

Alfonso
Set and Forget supply and demand trading community
 
 
  • Post #2,023
  • Quote
  • Sep 5, 2013 11:05am Sep 5, 2013 11:05am
  •  Olarion1975
  • Joined May 2010 | Status: Member | 1,068 Posts
Quoting Axlz
Disliked
Excellent webinar once again. Huge thanks to Alfonso for taking the time to hold these!
Ignored
I'll second that! Awesome stuff very well presented!!
 
 
  • Post #2,024
  • Quote
  • Sep 5, 2013 11:05am Sep 5, 2013 11:05am
  •  panoramia
  • | Commercial Member | Joined Aug 2011 | 3,525 Posts
A new version of the rectangle reader indicator has been uploaded to the first post of this thread, as well as some fixes to the SupportAndResistance indicator that draws last week/month highs/lows, and the ADR indicator. These two indicators no longer needs libraries, so you can delete them from your libraries folder.

The new rectangle indicator can be downloaded from the first post, this post, or from the next link:
http://www.forexfactory.com/attachme...7&d=1378393105

The new features have been described fully on today's webinar, they are:

  1. It changes the color for new rectangles to default demand and supply colors on the indicator (brown for supply and blue for demand) depending on weather its drawn above or below current price. If the rectangle is drawn around current price (high side of rectangle is above price and low side of rectangle is below price) then color does not change as I cannot determine if it should be a supply or demand rectangle
  2. Now manual Monthly rectangles are detected and the indicator will also automatically draw distal and proximal lines with 2 pixels thickness on Monthly SD levels. Default colors for monthly lines to Orange for Supply and Dark Turquoise for Demand

Thanks again to Peter (outapips) for coding these features and Thommy Tikka for the nice color change of rectangles when they are detected above/below current price!

Off to the beach now! Have a great day!

Alfonso

Attached File
File Type: ex4 RectangleReader.ex4   19 KB | 1 download
Set and Forget supply and demand trading community
 
 
  • Post #2,025
  • Quote
  • Sep 5, 2013 1:31pm Sep 5, 2013 1:31pm
  •  rtb
  • | Joined Jun 2009 | Status: Member | 16 Posts
I did realize after I posted that the automatic rectangles are not changed with the rectangle extender and you have confirmed this for me.
Thank you again Alphonso.
Cheers
Rob
 
 
  • Post #2,026
  • Quote
  • Edited at 2:06pm Sep 5, 2013 1:35pm | Edited at 2:06pm
  •  pres78
  • Joined Sep 2010 | Status: I'm not here... or am I? | 3,989 Posts
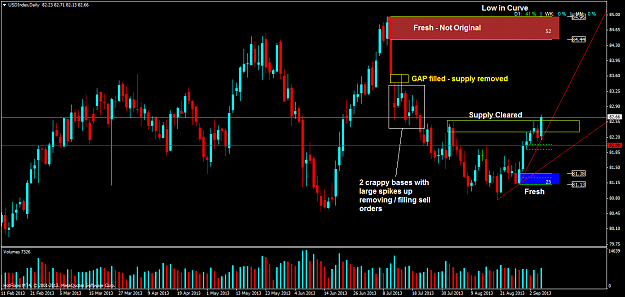
Appears as though we may be in store for some continued USD strength as the USD Index is set to take out the last decent daily and even 4hr supply zone which means there is not much decent supply left until 84.44 - 84.96 zone. We even filled the fairly large GAP that occured on July 10th - 11th. The two daily retraces that are overhead are vey ugly with lots of upper wicks removing supply orders which means the path should be mostly clear.
Today's zone = Tomorrow's opportunity!
 
 
  • Post #2,027
  • Quote
  • Sep 5, 2013 2:15pm Sep 5, 2013 2:15pm
  •  pres78
  • Joined Sep 2010 | Status: I'm not here... or am I? | 3,989 Posts
Quoting pres78
Disliked
Appears as though we may be in store for some continued USD strength as the USD Index is set to take out the last decent daily and even 4hr supply zone which means there is not much decent supply left until 84.44 - 84.96 zone. We even filled the fairly large GAP that occured on July 10th - 11th. The two daily retraces that are overhead are vey ugly with lots of upper wicks removing supply orders which means the path should be mostly clear.
Ignored
Follow up thoughts - it would be nice to see a return on the index to re-test that broken 82.56 Distal line as this should spell some retraces back to supply zones on USD pairs for nice shorts perhaps. We will see how the day closes, too bad NFP tommorow.
Today's zone = Tomorrow's opportunity!
 
 
  • Post #2,028
  • Quote
  • Sep 5, 2013 2:54pm Sep 5, 2013 2:54pm
  •  Axlz
  • | Joined Jul 2013 | Status: Member | 431 Posts
Quoting pres78
Disliked
{quote} Follow up thoughts - it would be nice to see a return on the index to re-test that broken 82.56 Distal line as this should spell some retraces back to supply zones on USD pairs for nice shorts perhaps. We will see how the day closes, too bad NFP tommorow.
Ignored
Indeed. There is also the G20 all day, so I am taking tomorrow off too.
 
 
  • Post #2,029
  • Quote
  • Edited at 5:26pm Sep 5, 2013 5:12pm | Edited at 5:26pm
  •  panoramia
  • | Commercial Member | Joined Aug 2011 | 3,525 Posts
Quoting Axlz
Disliked
{quote} Indeed. There is also the G20 all day, so I am taking tomorrow off too.
Ignored
Markets can go anywhere tomorrow! I took half of my day off today and tomorrow the whole day off! The beach, the gym, life is not only trading!

Will be posting the video now in a while! Will send a mass email to all those that subscribed to the webinar's list!

Alfonso
Set and Forget supply and demand trading community
 
 
  • Post #2,030
  • Quote
  • Sep 5, 2013 5:22pm Sep 5, 2013 5:22pm
  •  panoramia
  • | Commercial Member | Joined Aug 2011 | 3,525 Posts
Today's webinar has already been downloaded to YouTube. There are some of you who have already watched it. I went to the beach and it was being uploaded, those that are subscribed to my youtube page were the first ones

I believe we covered lots of important things today, hopefully you will have a much better idea of the whole methodology. Forward test it and check it out yourself.

This is the link to watch today's webinar!
http://www.youtube.com/watch?v=i9kI3...ature=youtu.be

Nite nite!
Alfonso
Set and Forget supply and demand trading community
 
 
  • Post #2,031
  • Quote
  • Sep 5, 2013 5:31pm Sep 5, 2013 5:31pm
  •  panoramia
  • | Commercial Member | Joined Aug 2011 | 3,525 Posts
Quoting pres78
Disliked
{quote} Follow up thoughts - it would be nice to see a return on the index to re-test that broken 82.56 Distal line as this should spell some retraces back to supply zones on USD pairs for nice shorts perhaps. We will see how the day closes, too bad NFP tommorow.
Ignored
I do take my day off always on NFP and big impact news, it's one of my rules! There is too much volatility, most of the month is fine for trading, except some big news days! You can make lots of pips but you can lose lots of them as well, I just try to avoid unnecessary losses.

Good luck with all of your trades Jason!
Alfonso
Set and Forget supply and demand trading community
 
 
  • Post #2,032
  • Quote
  • Sep 5, 2013 5:34pm Sep 5, 2013 5:34pm
  •  panoramia
  • | Commercial Member | Joined Aug 2011 | 3,525 Posts
Quoting ochinkumar
Disliked
hi alfonso, is this good set up.price pull back from a brand new demand area with in daily demand area. {image} {image}
Ignored
That setup was a valid one Ochin! Now you'd have to wait for those highs to be taken out on your entry timeframe and look for brand new levels of demand, most likely speedbumps could be formed. Watch that!

Alfonso
Set and Forget supply and demand trading community
 
 
  • Post #2,033
  • Quote
  • Sep 5, 2013 6:17pm Sep 5, 2013 6:17pm
  •  pres78
  • Joined Sep 2010 | Status: I'm not here... or am I? | 3,989 Posts
Quoting pres78
Disliked
Appears as though we may be in store for some continued USD strength as the USD Index is set to take out the last decent daily and even 4hr supply zone which means there is not much decent supply left until 84.44 - 84.96 zone. We even filled the fairly large GAP that occured on July 10th - 11th. The two daily retraces that are overhead are vey ugly with lots of upper wicks removing supply orders which means the path should be mostly clear.

[b]Follow up thoughts - it would be nice to see a return on the index to re-test that broken 82.56 Distal...
Ignored
Chart that I didn't have time to post earlier.
Attached Image (click to enlarge)
Click to Enlarge

Name: usdindexdaily.png
Size: 53 KB
Today's zone = Tomorrow's opportunity!
 
 
  • Post #2,034
  • Quote
  • Sep 5, 2013 6:25pm Sep 5, 2013 6:25pm
  •  pres78
  • Joined Sep 2010 | Status: I'm not here... or am I? | 3,989 Posts
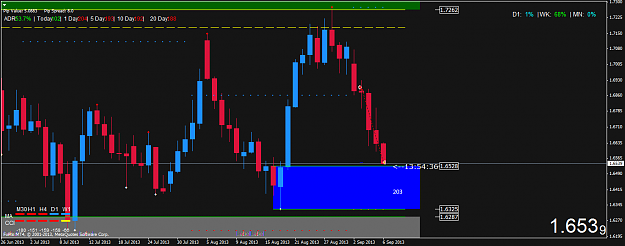
Take a look at EU Daily - does this look familiar (upside down but familiar). Look at the two demand bases below price and where we are in the curve? US Index upside down anyone ... Both have to move 50% to hit anything of value (well US Index needs to move 59%, but what's 9% between friends).

Will either of these reach their most obvious of targets... who knows but for me it's a confluence that has me watching closely.

Edit - I won't tell you that the ugly bases formed on the same days...
Attached Image (click to enlarge)
Click to Enlarge

Name: eurusd.daily.png
Size: 52 KB
Today's zone = Tomorrow's opportunity!
 
 
  • Post #2,035
  • Quote
  • Sep 5, 2013 7:44pm Sep 5, 2013 7:44pm
  •  pres78
  • Joined Sep 2010 | Status: I'm not here... or am I? | 3,989 Posts
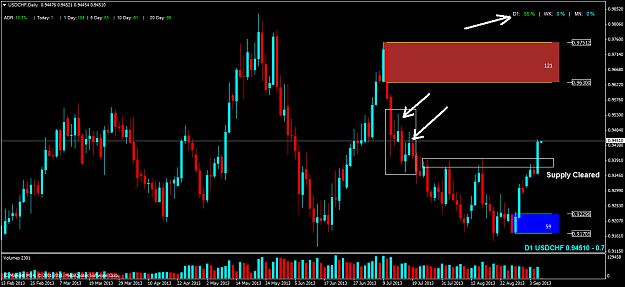
Since I am on a roll tonight... USDCHF... Same old, same old.

Follow the clues from chart to chart and after waiting patiently many opportunities may arrise simultaneously.

Great video once again Alfonso, well done and many thanks!
Attached Image (click to enlarge)
Click to Enlarge

Name: usdchfdaily.png
Size: 49 KB
Today's zone = Tomorrow's opportunity!
 
 
  • Post #2,036
  • Quote
  • Sep 6, 2013 2:33am Sep 6, 2013 2:33am
  •  panoramia
  • | Commercial Member | Joined Aug 2011 | 3,525 Posts
Quoting pres78
Disliked
Since I am on a roll tonight... USDCHF... Same old, same old. Follow the clues from chart to chart and after waiting patiently many opportunities may arrise simultaneously. Great video once again Alfonso, well done and many thanks! {image}
Ignored
I am glad that you lived the video Jason!

Thanks for those detailed and clear charts on the $index, USDCHF and EURUSD. I am sure people will see that much clearer. All 3 are tightly correlated. That's why I took the H4 short on the EURUSD yesterday.

  1. D1 demand on the euro had been taken out
  2. The euro weights 57.6% of the $index
  3. USDCHF D1 supply was taken out by very few pips, but taken out. Like I mentioned a few times on the thread, if D1 supply is taken out it can be 2 things: either a fakeout or a break
  4. USDCHF weights 3.6%
  5. EURO + SWISSIE make 61.2% of the $index. What do you think it's gonna happen if both D1 demand and supply are broken on the euro and the swissie?
  6. That weighted a lot on the index and it was finally broken after the double top

I didn't take the USDCHF demand on H4 (perfect demand), because my rules right now do not allow me to trade when there is ECB news, next day NFP and so on. But they were nice trades following the SD methodology.

Alfonso

Set and Forget supply and demand trading community
 
 
  • Post #2,037
  • Quote
  • Edited at 3:33am Sep 6, 2013 3:07am | Edited at 3:33am
  •  panoramia
  • | Commercial Member | Joined Aug 2011 | 3,525 Posts
Not trading today, doing some homework on my demo account, and today is NFP day. But I wanted to share with you a couple of things.

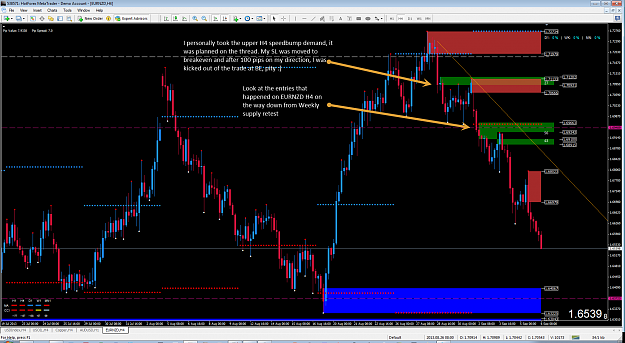
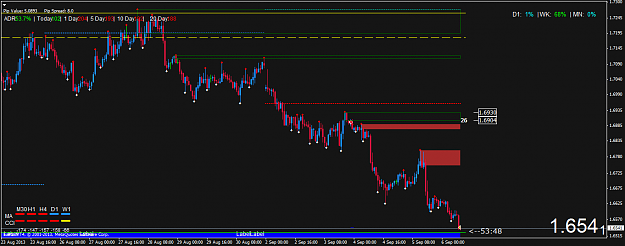
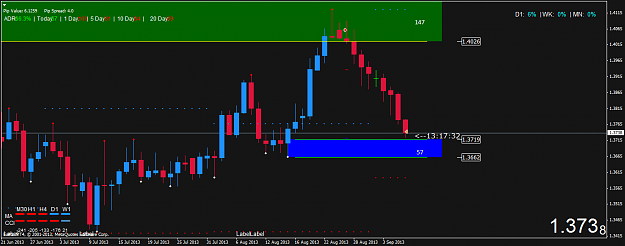
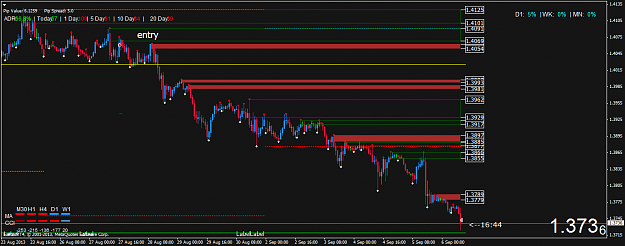
Look at the entries that happened on EURNZD H4 on the way down from Weekly supply retest. I personally took the upper H4 speedbump supply at 1.7093, it was planned on the thread and I know that at least a couple of you took it. My SL was moved to breakeven and after 100 pips on my direction, I was kicked out of the trade at BE, pity

There will be plenty of those. As you can see, that's just following the methodology, nothing complex, you don't have to fry your brain out to put together a trade that can give you +5:1. Look at the H4 charts on most of the pairs and you will see what I mean, it's just supply and demand!

Alfonso
Attached Image (click to enlarge)
Click to Enlarge

Name: Screenshot1.png
Size: 151 KB
Set and Forget supply and demand trading community
 
 
  • Post #2,038
  • Quote
  • Sep 6, 2013 3:09am Sep 6, 2013 3:09am
  •  sebkor6
  • | Joined Jul 2013 | Status: Member | 132 Posts
Quoting sebkor6
Disliked
Hi, here are some of my trades: aud usd hits weekly supply, so i closed one of positions. +185 pips. Sl 11 pips. RR ąlmost 1:18 Another position i decided to hold, because we bounced from monthly demand area. eur nzd sell. Supply in controll. Took sell on h1 supply area. Now + 205 pips. eur cad sell. Supply in controll. For now + 225. Hope that will hit the target. {image} {image} {image} {image}
Ignored
eur nzd in target + 358 pips. RR 1:9,9
Attached Images (click to enlarge)
Click to Enlarge

Name: eurnzddaily.png
Size: 41 KB Click to Enlarge

Name: eurnzdh1.png
Size: 35 KB
 
 
  • Post #2,039
  • Quote
  • Sep 6, 2013 3:45am Sep 6, 2013 3:45am
  •  sebkor6
  • | Joined Jul 2013 | Status: Member | 132 Posts
Quoting sebkor6
Disliked
{quote} eur nzd in target + 358 pips. RR 1:9,9 {image} {image}
Ignored
eur cad in target too +319 pips. RR the same 1:9,9

Thank's Alfonso for everything !!!
Attached Images (click to enlarge)
Click to Enlarge

Name: eurcaddaily.png
Size: 34 KB Click to Enlarge

Name: eurcadh1.png
Size: 37 KB
 
 
  • Post #2,040
  • Quote
  • Sep 6, 2013 3:45am Sep 6, 2013 3:45am
  •  bam5555
  • | Joined Sep 2013 | Status: Member | 11 Posts
Hello.... This is a great way of trading.. I am new ...I can't get the % on D1 Wk Mn they just read 0%... If I am missing something please advise
 
 
  • Commercial Content
  • /
  • Supply and demand in a nutshell by Alfonso Moreno
  • Reply to Thread
    • 1 100101Page 102103104 486
    • 1 Page 102 486
0 traders viewing now
  • More
Top of Page
Forex Factory Blog Updated: Alerting All Members
  • Facebook
  • Twitter
About FF
  • Mission
  • Products
  • User Guide
  • Media Kit
  • Blog
  • Contact
FF Products
  • Forums
  • Trades
  • Calendar
  • News
  • Market
  • Brokers
  • Trade Explorer
FF Website
  • Homepage
  • Search
  • Members
  • Report a Bug
Follow FF
  • Facebook
  • Twitter

FF Sister Sites:

  • Metals Mine
  • Energy EXCH
  • Crypto Craft

Forex Factory® is a brand of Fair Economy, Inc.

Terms of Service / ©2022