{quote} If that line above the price is the 200ema, I think neither of the last four entries are valid, as tne 200ema es between toy trade and your TP....
EURUSD - Daily why last 3 signals are bad ? {image}
Ignored
1) there is 200 MA in front, so these trades are skippable.
however if you follow the rules and put buy stop at the top of the wick of the candle, none of the trades would have triggered on the next candle, after 24 hours all pending trades are cancelled on daily chart.
{quote} not sure about your calculation here is how I calculate 12 (day) * 5 = 60 (week) as there are 5 trading days in a week. 12 (day) * 20 = 240 (month) as there are 20 trading days in a month on avg.
Ignored
Yes, my first assumption was wrong, what do you think about this one?
I' think that the trading days on a month are 21 on avg and not 20.
The calculation is:
365(day/year)/12(month)= 30,416 days in a month
30,416/7(days/week)=4,345 week in a month
4,345*5(trading days in a week)=21,726 trading days on a month... so more or less 22
If we want to consider some extra days of market close (christmas, etc...) I think we can use 21 instead of 20.
What do you think garfield? (sorry for my poor english )
{quote} 1) there is 200 MA in front, so these trades are skippable. however if you follow the rules and put buy stop at the top of the wick of the candle, none of the trades would have triggered on the next candle, after 24 hours all pending trades are cancelled on daily chart. hope that clarifies some of the rules.
{quote} Yes, my first assumption was wrong, what do you think about this one? I' think that the trading days on a month are 21 on avg and not 20. The calculation is: 365(day/year)/12(month)= 30,416 days in a month 30,416/7(days/week)=4,345 week in a month 4,345*5(trading days in a week)=21,726 trading days on a month... so more or less 22 If we want to consider some extra days of market close (christmas, etc...) I think we can use 21 instead of 20. What do you think garfield? (sorry for my poor english )
Ignored
not sure of 21 is going to make a big difference from 20. you can probably take to chart of same currency and do a back test to compare the result between 20 and 21.
Quite few trade triggered on close of candle at 7 PM my time.
EURCAD short was a perfect trade in and out within same candle. I am currently long on GBPUSD and NZDJPY on 4 hour chart and GBPJPY and GBPCAD on daily chart.
Hi all. On my side, I opened 4 orders since yesterday:
GBPAUD sell: stopped at BE. Badluck here as price stopped me out before plunging.
EURGBP sell: stopped at BE
GBPJPY buy: still opened with SL at BE.
EURUSD short: currently in the red.
{quote} not sure of 21 is going to make a big difference from 20. you can probably take to chart of same currency and do a back test to compare the result between 20 and 21.
Ignored
Sure.... I hope someone make an EA, so we can fine tune this nice system.
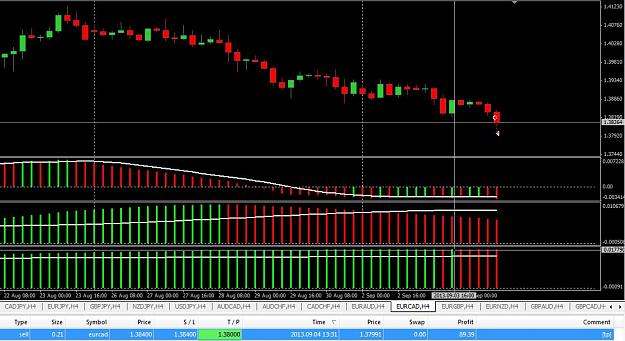
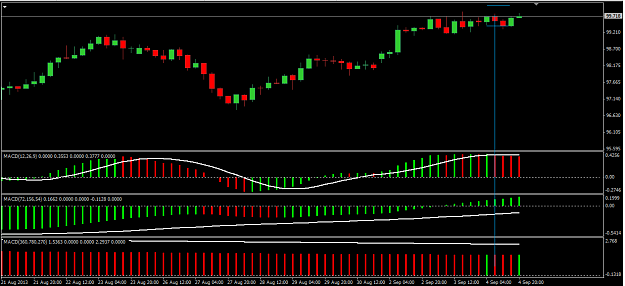
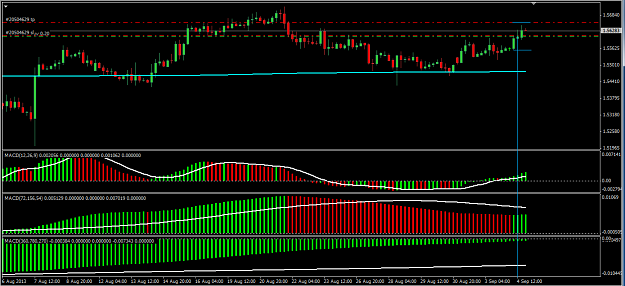
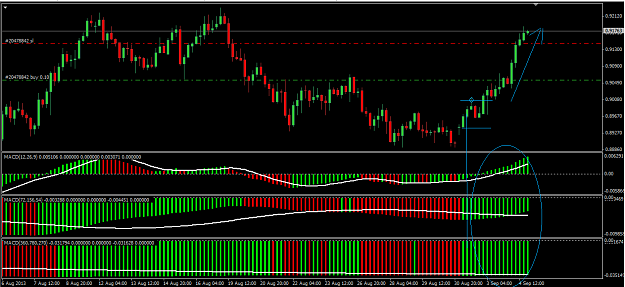
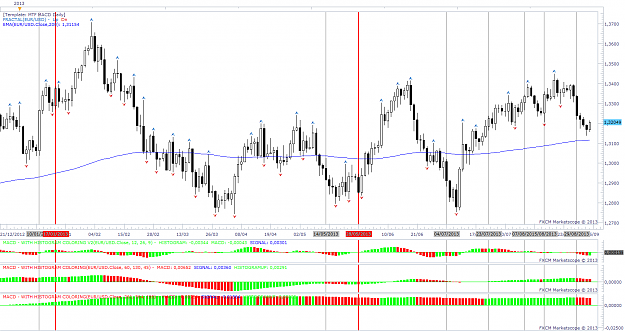
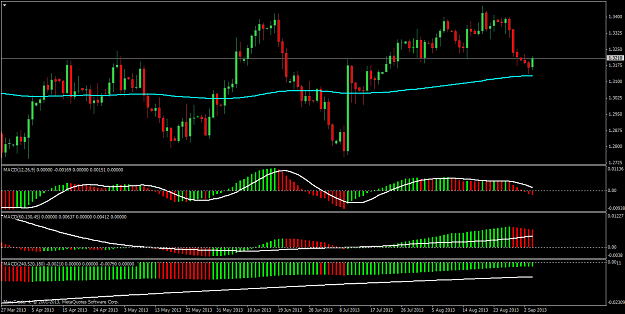
Ok, thanks for the answers garfield. I attach 3 more graphs. Two of them are trades taken today, one loser (UJ), one still open, now at BE (GU), and the third one is not a trade, it's only an example to make one question. In this last graph (AU), if we had entered where I point in the blue vertical line, we may have reached TP later, but if I understand the system, then there is no more trigger signal to reenter, as there is no change from red to green and we don't profit a beautifull uptrend.....
{quote} Hmmm, on my chart EMA200 is located on different place. {image}
Ignored
The EUR chart you posted on post #78 has the MA in the right place.
What did you change on your chart between then and now to show the MA on different place ? on daily chart, check you EMA setting it shoud be 200 and on 4 hours it should be 1200.
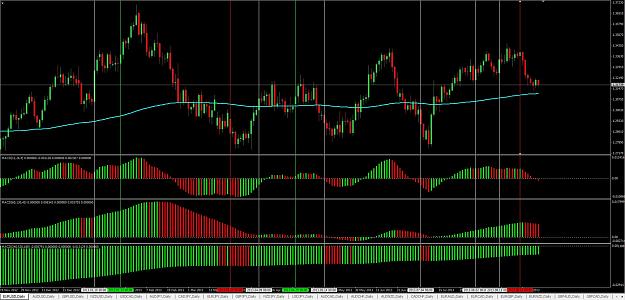
Hey guys, I've backtested 2013's EURUSD Daily and unfortunately this are the results: 2 Losses 7 Break Even 0 Wins Am I right or am I missing something? {image}
Ignored
I did a quick back test
2 Positive
4 breakeven
2 loser
Ok, thanks for the answers garfield. I attach 3 more graphs. Two of them are trades taken today, one loser (UJ), one still open, now at BE (GU), and the third one is not a trade, it's only an example to make one question. In this last graph (AU), if we had entered where I point in the blue vertical line, we may have reached TP later, but if I understand the system, then there is no more trigger signal to reenter, as there is no change from red to green and we don't profit a beautifull uptrend..... {image} {image} {image}
Ignored
I do use my discreation sometimes in taking or skipping trade. i.e as mention earlier by Fbird UJ was approaching 100 price, which is why I skipped that trade.
I have a GU trade open which is at breakeven too,
With AUD chart, we can only admire the uptrend in hindsight, since we can't predict the market, my system is aimed at more of a hit and run approach of taking money out of the market whenever there is an opportunity.
I have had 2 EURNZD, 1 EURCAD & 1 NZDJPY trades yesterday and all closed in profit. Can't complain on that result.
{quote} , none of the trades would have triggered on the next candle, after 24 hours all pending trades are cancelled on daily chart. hope that clarifies some of the rules.
Ignored
I do understand, relatively if trade is not trigered within next candle after (next 4 hours) the pending orders is cancelled....?
{quote} Here it is, White line = breakeven Red = Loss Green = Profit {image}
Ignored
On a very first view I've seen that you dont include week end data (i.e. sunday data) in your monday candle as I do, in addition, I've seen that your 12.26.9 MACD is different from mine, maybe due to week end data... I'll retry without Sunday data and post as soon as possible....
In your opinion is correct to discard sunday data from charts?
{quote} On a very first view I've seen that you dont include week end data (i.e. sunday data) in your monday candle as I do, in addition, I've seen that your 12.26.9 MACD is different from mine, maybe due to week end data... I'll retry without Sunday data and post as soon as possible.... In your opinion is correct to discard sunday data from charts? thanx
Ignored
My broker doesn't provide sunday data. So it was never part of my system.