• Home
  • Forums
  • Trades
  • News
  • Calendar
  • Market
  • Brokers
  • Login
  • Join
  • User/Email: Password:
  • 3:43pm
Menu
  • Forums
  • Trades
  • News
  • Calendar
  • Market
  • Brokers
  • Login
  • Join
  • 3:43pm
Sister Sites
  • Metals Mine
  • Energy EXCH
  • Crypto Craft

Options

Bookmark Thread

First Page First Unread Last Page Last Post

Print Thread

Similar Threads

Supply and Demand Zones 45 replies

Price movement as a function of Supply and Demand 43 replies

Supply and demand zones and EW principles 1 reply

How Markets Work, in a Nutshell! 32 replies

Demand and Supply 1 reply

  • Commercial Content
  • /
  • Reply to Thread
  • Subscribe
  • 5,251
Attachments: Supply and demand in a nutshell by Alfonso Moreno
Exit Attachments
Tags: Supply and demand in a nutshell by Alfonso Moreno
Cancel

Supply and demand in a nutshell by Alfonso Moreno

  • Last Post
  •  
  • 1 8788Page 899091 486
  • 1 Page 89 486
  •  
  • Post #1,761
  • Quote
  • Aug 31, 2013 10:01am Aug 31, 2013 10:01am
  •  everfree
  • | Joined Oct 2007 | Status: Member | 6 Posts
Quoting randolf
Disliked
guys my internet very slow can not view the video where is entry point in system ؟
Ignored
Watching the videos makes it much easier to learn this method of trading. So much is covered in them and it eliminates a lot of wasted time asking and answering questions that are already covered.

I have a slow connection too and have found it's easiest to watch online videos after they have been downloaded to my computer.

My favorite downloader for YouTube or anything else is Internet Download Manager but you have to pay for it after the trial period. IDM works very well for multiple downloads.

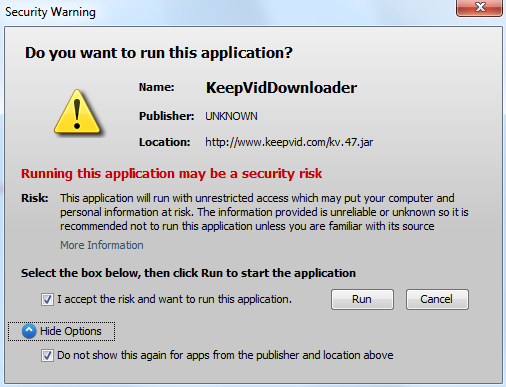
You also can download YouTube videos for free at www.keepvid.com. You have to give the application permission to run:

Attached Image
You DO NOT have to Update Media Player or anything else. Use at your own risk, I never had any trouble with it.
 
 
  • Post #1,762
  • Quote
  • Aug 31, 2013 10:26am Aug 31, 2013 10:26am
  •  ashtrader
  • | Joined Apr 2013 | Status: Member | 86 Posts
Quoting panoramia
Disliked
{quote} Hi Ash! Yes, you read correctly. You have to look right if a level is fresh or not You have to look left to see if a level is original or not You have to look left and right to see if a level is original AND fresh at the same time Freshness of a level is known when you look right, you have to see if price has pulled back into the level or not To know how original a level is you need to look left because you need to look at the origin of the level For fresh levels you don't need to pay attention to the origin really, but only if price has...
Ignored
Thanks so much,super explanation Alphonso, Have a great weekend, and one day for sure i will buy you a mojito!
 
 
  • Post #1,763
  • Quote
  • Edited Sep 1, 2013 3:11am Aug 31, 2013 12:56pm | Edited Sep 1, 2013 3:11am
  •  vijay14
  • | Joined Aug 2013 | Status: Member | 9 Posts
Dear panoramia,

I have seen all the video's. Great effort you have made to prepare for that. Still i had some confusion. Sorry for the laymen questions.

My basic understanding of chart setup for intraday trading

01. Daily chart with supply and demand zones.
02. 4 hour chart with 20 & 50 EMA for direction of trade.
03. 1 hour chart for entires.

My market is 6 hours 15 minutes per day, not like 24 hours in forex. I used 4 hours chart with 20,50 EMA for direction of trend. 1 hour chart for entries.

Am i right?
 
 
  • Post #1,764
  • Quote
  • Aug 31, 2013 4:02pm Aug 31, 2013 4:02pm
  •  astronaud
  • | Joined Jul 2013 | Status: Member | 22 Posts
Does anybody have S/D ZONESindicator for MT5?We all have it for MT4,but sooner or later we will need it.I would like to help,but i am not a programer
 
 
  • Post #1,765
  • Quote
  • Aug 31, 2013 5:21pm Aug 31, 2013 5:21pm
  •  caparzo
  • | Joined Aug 2013 | Status: Member | 58 Posts
hi guys,
i am abit confused about how to draw Demand areas on Daily chart of EUR/USD, at White circled area.
can anybody help?
Attached Image (click to enlarge)
Click to Enlarge

Name: eurusd daily.png
Size: 56 KB
 
 
  • Post #1,766
  • Quote
  • Edited 7:21pm Aug 31, 2013 6:15pm | Edited 7:21pm
  •  pres78
  • Joined Sep 2010 | Status: I'm not here... or am I? | 3,990 Posts
Not sure if anyone else will find this useful but I compile range reports a few times a year to keep and eye on pairs both that I am trading and also those that I am not. What this does is it allows me to see when pairs are starting to move more or less than they used to an I can in turn adjust my trading plan pairs to suit. Personally if a paid does not move at least 100 pips a day I don't want to waste my time because all trades take longer to play out.

This is just a few pairs as for some reason my custom range indi is not loading properly on my second broker whom offers many more forex pairs as well as some CFD's so once the market opens Sunday I will be able to expand the list.

ADR (520) = Average Daily Range for 520 days
AWR (104) = Average Weekly Range for 104 weeks
AMR (24) = Average Monthly Range for 24 months

Yellow highlights are for ADR's greater than 100 and green is the new "BEAST"... as you can see over the last 2 years GBPJPY has lost it's title to GBPNZD mind you GBPJPY is still a nicely moving pair.
Attached File(s)
File Type: pdf Ranges.pdf   123 KB | 1,722 downloads
Today's zone = Tomorrow's opportunity!
 
 
  • Post #1,767
  • Quote
  • Aug 31, 2013 6:23pm Aug 31, 2013 6:23pm
  •  panoramia
  • | Commercial Member | Joined Aug 2011 | 3,539 Posts
Quoting randolf
Disliked
GBPJPY What is your analysis of this exchange? up or down or sideway According to the post before pictures
Ignored
Hello Randolf!
I can't give you my analysis on gppjpy for some reasons:

1. You have not read the first post a few times to understand what we are trying to do in this thread
2. You haven't watched the videos. If you don't have a goog internet connection, you need to find one and watch the videos a few times to understand the methodology
3. You are not using the indicators provided in the first post
4. You haven't taken the time to learn the basics so I can't waste my time if you don't waste yours

We can't help you if you don't ething on your side, and that is studying the methodology and following the rules explained both in the thread and on all the videos and webinars. That can take weeks.

So please, before you post more charts, take a few days to understand it all and follow the rules on the thread, as well as using the indicators you cand download. Trying to help you without u doing that is a waste of time, sorry.

Alfonso
Set and Forget supply and demand trading community
 
 
  • Post #1,768
  • Quote
  • Aug 31, 2013 6:31pm Aug 31, 2013 6:31pm
  •  panoramia
  • | Commercial Member | Joined Aug 2011 | 3,539 Posts
Quoting caparzo
Disliked
hi guys, i am abit confused about how to draw Demand areas on Daily chart of EUR/USD, at White circled area. can anybody help? {image}
Ignored
That D1 demand is not good. Too much time at the level, wicky candles, not fresh and not a big imbalance. If you use the odds enhancers score system, you will get a very low score.

If the sd area is wicky, too much time and the level and not fresh, you shouldn't even paint it. Only draw those that are clear and obvious, with a high score on the odds enhancers. If you see that area clearly, big boys will do as well!

Alfonso
Set and Forget supply and demand trading community
 
 
  • Post #1,769
  • Quote
  • Edited Sep 1, 2013 3:48am Aug 31, 2013 8:16pm | Edited Sep 1, 2013 3:48am
  •  Axlz
  • | Joined Jul 2013 | Status: Member | 431 Posts
Hello Alfonso,

Hope you have been having a great weekend.

As always, I have been studying this thread and my charts. I have compiled a list of 4H entries I want to place next week. I would appreciate it if you could look over these and give your opinion on each of them.

If market conditions change (for instance, if we reach a higher TF demand/supply area), I will reevaluate my entries. These are just entries under current market conditions.


GBPJPY 4H - 152.882 Short (Your entry) -


Attached Image (click to enlarge)
Click to Enlarge

Name: gbpjpy 4h.png
Size: 42 KB


AUDNZD 4H - 1.15545 Short -

Attached Image (click to enlarge)
Click to Enlarge

Name: AUDNZD 4H.png
Size: 44 KB


EURNZD 4H - 1.71992 Short -

Attached Image (click to enlarge)
Click to Enlarge

Name: eurnzd 4h.png
Size: 41 KB


SP500 4H - 1662.20 Short -

Attached Image (click to enlarge)
Click to Enlarge

Name: SP500 H4.png
Size: 45 KB


GBPCHF 4H - 1.44770 Short -

Attached Image (click to enlarge)
Click to Enlarge

Name: GBPCHF 4H.png
Size: 41 KB


GBPAUD 4H - 1.74543 Short -

Attached Image (click to enlarge)
Click to Enlarge

Name: GBPAUD 4H.png
Size: 41 KB
 
 
  • Post #1,770
  • Quote
  • Sep 1, 2013 5:04am Sep 1, 2013 5:04am
  •  panoramia
  • | Commercial Member | Joined Aug 2011 | 3,539 Posts
Quoting Shaka_Smart
Disliked
Hi Alfonso, I started paper trading, and sometimes questions come up then that you didn't consider before. I was wondering if you scale out of positions and how you decide to do that. Also, when you have exited the supply or demand zone and then retest the zone, do you move your stop loss? Should I ever move my stop loss, or just be a robot and let it run no matter what? Also, do you only trade when all zones are in congruence (ie all demand or all supply) and when all are trending the sam direction? I started reading "Trading in the Zone", and...
Ignored
Hell Nick,
I don't normally scale out of my positions unless there is a good opposing original level between my entry and my final take profit, and I seldom do that. I've realized that no matter what I do, price will most likely hit my target, and if my trade didn't reach it is because either I moved SL to breakeven too early (normally 2:1 of my risk) or I closed my trade too soon. So the best we can do is letting the trade work, give it breathing room and trust that our analysis is correct.

My trading is now going in the direction of not moving SL to BE so soon, on higher timeframes areas, my BE is now at 4:1 or 5:1, or when the previous S/R area has been taken out, that's what I call a good breathing room and confirmation that price would most likely continue in my direction. Trading in the zone book is great, one of my favs

Alfonso
Set and Forget supply and demand trading community
 
 
  • Post #1,771
  • Quote
  • Sep 1, 2013 5:22am Sep 1, 2013 5:22am
  •  panoramia
  • | Commercial Member | Joined Aug 2011 | 3,539 Posts
Quoting Nametaker
Disliked
{quote} Hi Alfonso, could i ask why you have the level 155.882 marked as fresh. I placed a horizontal line at its peaked and traced back its origin and it is a reaction to a previous level, albeit not the best level. Is there a reason you have marked it as fresh instead of OG? P.S I know it is fresh by looking to the right. But if you look to the left it is a reaction to a previous level. Could you clear my thinking on this one please because i drew it as og and touched. Nick
Ignored
Hi Nick!
You are right. It's a reaction to a previous D1 area, a level which is not very good. The reasons why I drew that D1 supply level is because I wanted to see that that level produced a decent reaction and it's a resistance there. Monthly supply is close at 158.03, and when we're that high in the curve, many times levels are formed and the higher timeframe supply area is not hit and price drops. But yes, it's fresh but not original. I just have it painted there because I'd do confirmation type of trade in that area, but not set & forget. I would wait for a better level within the Monthly supply area which is a bit higher.

Alfonso
Set and Forget supply and demand trading community
 
 
  • Post #1,772
  • Quote
  • Sep 1, 2013 5:26am Sep 1, 2013 5:26am
  •  Axlz
  • | Joined Jul 2013 | Status: Member | 431 Posts
Quoting panoramia
Disliked
{quote} Hi Nick! You are right. It's a reaction to a previous D1 area, a level which is not very good. The reasons why I drew that D1 supply level is because I wanted to see that that level produced a decent reaction and it's a resistance there. Monthly supply is close at 158.03, and when we're that high in the curve, many times levels are formed and the higher timeframe supply area is not hit and price drops. But yes, it's fresh but not original. I just have it painted there because I'd do confirmation type of trade in that area, but not set &...
Ignored
But Alfonso, That D1 supply did not take out any demand, so it isn't valid? Or am I incorrect?
 
 
  • Post #1,773
  • Quote
  • Sep 1, 2013 5:32am Sep 1, 2013 5:32am
  •  panoramia
  • | Commercial Member | Joined Aug 2011 | 3,539 Posts
Quoting vijay14
Disliked
Dear panoramia, I have seen all the video's. Great effort you have made to prepare for that. Still i had some confusion. Sorry for the laymen questions. My basic understanding of chart setup for intraday trading 01. Daily chart with supply and demand zones. 02. 4 hour chart with 20 & 50 EMA for direction of trade. 03. 1 hour chart for entires. My market is 6 hours 15 minutes per day, not like 24 hours in forex. I used 4 hours chart with 20,50 EMA for direction of trend. 1 hour chart for entries. Am i right?
Ignored
Hello there!
Not using the 20 & 50 EMAs now. It's part of another type of trade which I was working with, and I still need to integrate on SD level trading. Use the content on Post #1. I believe the EMAs were removed from that post, they are not being used to take any kind of decisions, only as confluence if you want to.

Choose any of these two combinations:

D1 as the curve timeframe
H1 as the entry timeframe

WK as the curve
H4 as the entry timeframe

Alfonso
Set and Forget supply and demand trading community
 
 
  • Post #1,774
  • Quote
  • Sep 1, 2013 5:35am Sep 1, 2013 5:35am
  •  panoramia
  • | Commercial Member | Joined Aug 2011 | 3,539 Posts
Quoting Axlz
Disliked
{quote} But Alfonso, That D1 supply did not take out any demand, so it isn't valid? Or am I incorrect?
Ignored
That D1 supply area took out previous 2 D1 demand areas within the red rectangles, and solidly broke ascending D1 trendline, so it's more than valid. I am not taking about the original of that D1 supply, but the one I currently have drawn on the chart I shared with you. See my screenshot.
Alfonso
Attached Image (click to enlarge)
Click to Enlarge

Name: Screenshot1.png
Size: 130 KB
Set and Forget supply and demand trading community
 
 
  • Post #1,775
  • Quote
  • Sep 1, 2013 5:41am Sep 1, 2013 5:41am
  •  Axlz
  • | Joined Jul 2013 | Status: Member | 431 Posts
Quoting panoramia
Disliked
{quote} That D1 supply area took out previous 2 D1 demand areas within the red rectangles, and solidly broke ascending D1 trendline, so it's more than valid. I am not taking about the original of that D1 supply, but the one I currently have drawn on the chart I shared with you. See my screenshot. Alfonso {image}
Ignored
Oh my apologies ! I thought we were talking about another level.

The S&D indicator keeps repainting levels I deleted and I got confused again. My apologies. You were correct.
 
 
  • Post #1,776
  • Quote
  • Sep 1, 2013 5:44am Sep 1, 2013 5:44am
  •  panoramia
  • | Commercial Member | Joined Aug 2011 | 3,539 Posts
Quoting Axlz
Disliked
{quote} Oh my apologies ! I thought we were talking about another level. The S&D indicator keeps repainting levels I deleted and I got confused again. My apologies. You were correct.
Ignored
This is why painting the higher timeframe SD areas MANUALLY will help. You should have the D1/W1/MN checkboxes under automatic SD indicator visualization properties unchecked so that we you draw your zones, they won't be repainted and you will know if they are still valid or not, fresh or non fresh, taken out or not.


Alfonso
Set and Forget supply and demand trading community
 
 
  • Post #1,777
  • Quote
  • Sep 1, 2013 6:26am Sep 1, 2013 6:26am
  •  panoramia
  • | Commercial Member | Joined Aug 2011 | 3,539 Posts
Quoting Axlz
Disliked
Hello Alfonso, Hope you have been having a great weekend. As always, I have been studying this thread and my charts. I have compiled a list of 4H entries I want to place next week. I would appreciate it if you could look over these and give your opinion on each of them. If market conditions change (for instance, if we reach a higher TF demand/supply area), I will reevaluate my entries. These are just entries under current market conditions. GBPJPY 4H - 152.882 Short (Your entry) - {image} AUDNZD 4H - 1.15545 Short - {image} EURNZD 4H - 1.71992 Short...
Ignored
Hello Axlz!
I had a very quick look at your entries before I leave to do some trekking. I don't have my charts opened now, and I am basing my comments on what you are showing me, based on your higher timeframe levels, not mine, which could be different. I don't see the D1/WK rectangle indicator trendlines on most of your entries, so it's more difficult for me to help since I don't know where those areas are located.

Here are my comments:

  1. GBPJPY H4 SHORT. You level is right at the D1 proximal line, a good imbalance, I believe I have an order there, but not sure now
  2. AUDNZD H4 SHORT. You entry is right at the D1 proximal line, took out previous demand. Looks good. I believe i have one order there but drilled since I think it was a bit wide
  3. EURNZD H4 SHORT. I believe that level was at a weekly supply area, but I don't quite remember right now. If that's the case, I believe I do have an order there as well, but level was too wide and I drilled it down to fit my H4 45 pips risk tolerance on EURNZD
  4. S&P500 H4 SHORT. Nice imbalance respecting TL. I believe do have an order there as well based on that H4 descending trendline, if the TL is respected the order will stay there, unless previous higher timeframe D1 area is touched
  5. GBPCHF H4 SHORT. I don't trade this pair, but your entry is located right after the D1 suply area is broken, too much trading in the area and wicky
  6. GBPAUD H4 SHORT. I don't trade this pair either, I do trade EURAUD which is highly correlated. I don't seet he D1/W1 trendlines for the S/D areas so I can't give you any comments on this one, but it looks like it's been almost tested a couple of times and it didn't go too far, so it doesn't look good to me. But again, I don't know where you have your higher timeframes SD areas

My entries will still be there if market conditions don't change or my rules are not broken. We'll see what happens in the next days.

Hope that helps!
Alfonso

Now off to the mountains

Set and Forget supply and demand trading community
 
 
  • Post #1,778
  • Quote
  • Sep 1, 2013 6:46am Sep 1, 2013 6:46am
  •  Axlz
  • | Joined Jul 2013 | Status: Member | 431 Posts
Quoting panoramia
Disliked
{quote} Hello Axlz! I had a very quick look at your entries before I leave to do some trekking. I don't have my charts opened now, and I am basing my comments on what you are showing me, based on your higher timeframe levels, not mine, which could be different. I don't see the D1/WK rectangle indicator trendlines on most of your entries, so it's more difficult for me to help since I don't know where those areas are located. Here are my comments: GBPJPY H4 SHORT. You level is right at the D1 proximal line, a good imbalance, I believe I have an order...
Ignored

Thank you so much my friend!

Enjoy your time at the mountains!
 
 
  • Post #1,779
  • Quote
  • Sep 1, 2013 7:08am Sep 1, 2013 7:08am
  •  marsiwala
  • | Joined Aug 2013 | Status: Member | 3 Posts
Quoting Axlz
Disliked
Hello Alfonso, Hope you have been having a great weekend. As always, I have been studying this thread and my charts. I have compiled a list of 4H entries I want to place next week. I would appreciate it if you could look over these and give your opinion on each of them. If market conditions change (for instance, if we reach a higher TF demand/supply area), I will reevaluate my entries. These are just entries under current market conditions. GBPJPY 4H - 152.882 Short (Your entry) - {image} AUDNZD 4H - 1.15545 Short - {image} EURNZD 4H - 1.71992 Short...
Ignored

In your first chart are the middle supply zone(Lowest) and the demand zone (Highest) valid?
As per rules they dont seem to be valid. Pl clearify. Thanks
 
 
  • Post #1,780
  • Quote
  • Sep 1, 2013 10:22am Sep 1, 2013 10:22am
  •  Axlz
  • | Joined Jul 2013 | Status: Member | 431 Posts
Quoting panoramia
Disliked
{quote} Hello Axlz! I had a very quick look at your entries before I leave to do some trekking. I don't have my charts opened now, and I am basing my comments on what you are showing me, based on your higher timeframe levels, not mine, which could be different. I don't see the D1/WK rectangle indicator trendlines on most of your entries, so it's more difficult for me to help since I don't know where those areas are located. Here are my comments: GBPJPY H4 SHORT. You level is right at the D1 proximal line, a good imbalance, I believe I have an order...
Ignored

A little analysis on GBPAUD:


That 4H level is fresh and original. It was ALMOST touched a couple of times, but not exactly.


Attached Image (click to enlarge)
Click to Enlarge

Name: GBPAUD 4H1.png
Size: 42 KB


To see if original or not, I followed the zone I marked into the past:


Attached Image (click to enlarge)
Click to Enlarge

Name: GBPAUD 4H2.png
Size: 37 KB


On the daily, the 4H zone I marked is on the Proximal line of an unfresh Daily supply.


Attached Image (click to enlarge)
Click to Enlarge

Name: GBPAUD daily.png
Size: 34 KB


What do you think now? Still a bad idea to short, or not ?
 
 
  • Commercial Content
  • /
  • Supply and demand in a nutshell by Alfonso Moreno
  • Reply to Thread
    • 1 8788Page 899091 486
    • 1 Page 89 486
5 traders viewing now
  • More
Top of Page
  • Facebook
  • Twitter
About FF
  • Mission
  • Products
  • User Guide
  • Media Kit
  • Blog
  • Contact
FF Products
  • Forums
  • Trades
  • Calendar
  • News
  • Market
  • Brokers
  • Trade Explorer
FF Website
  • Homepage
  • Search
  • Members
  • Report a Bug
Follow FF
  • Facebook
  • Twitter

FF Sister Sites:

  • Metals Mine
  • Energy EXCH
  • Crypto Craft

Forex Factory® is a brand of Fair Economy, Inc.

Terms of Service / ©2023