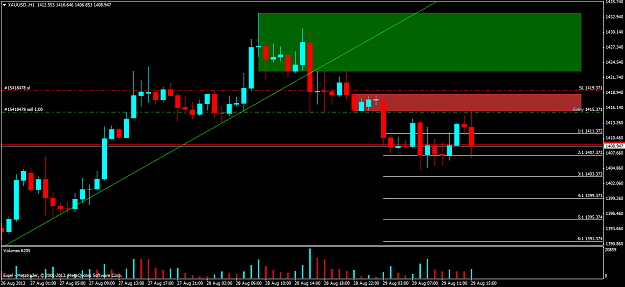
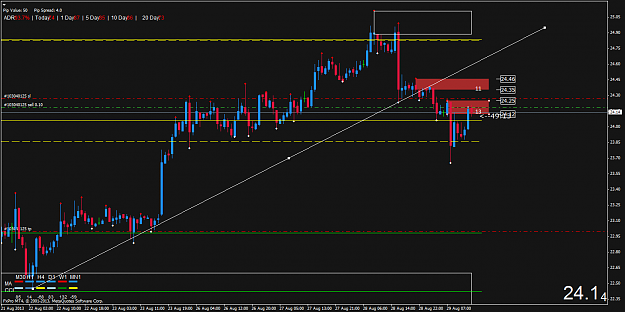
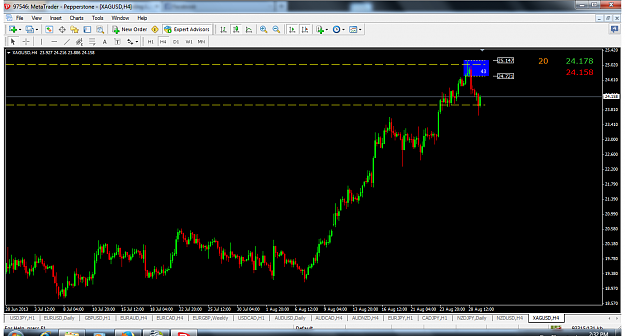
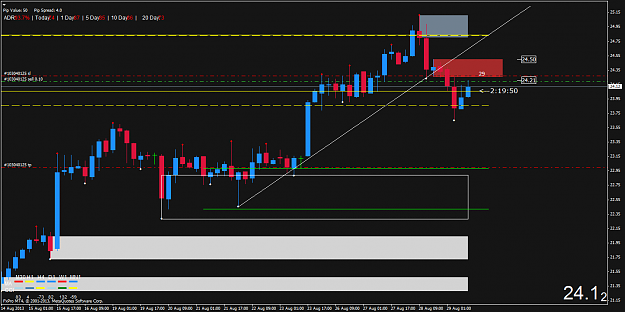
I think that our expectations about silver and gold were to early. We should always wait for price to close at least on daily chart, above valid supply. In this case (look at daily chart), we see only spike. Price closed inside supply areas, wasnt able to close above them. So IMHO, weekly and daily supply levels are still valid, and dynamics of the market has changed. Look at the h1 chart. Think that we can look for sell. What do you think? {image} {image} {image}
{quote} Hmm. Daily supply was taken out, and daily demand still seems to be in control.
Ignored
Hi Axlz,
please look at my post nr 1.595.
I think, that supply areas weekly and daily are still valid. Price coulnd't hold above those areas. Look at the daily last bar. It was just spike, and price went down to the supply area again. I saw that kind of actions many times. Maybe i am wrong, but i think that now sellers are in controll.
Let's see if Alfonso can confirm or deny this
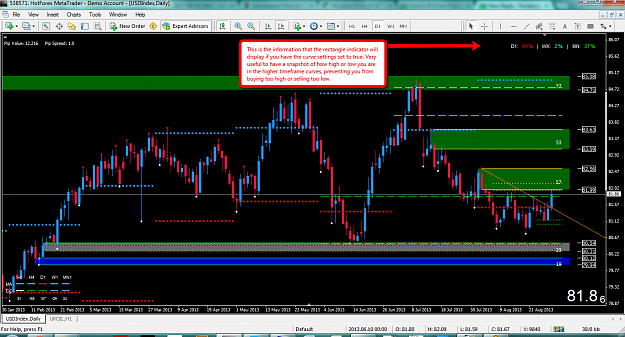
I've added new and important settings to the rectangle reader indicator that will help us determine how how or how low we are in the higher timeframe curves, Daily and above timeframes. I had thought of these features long ago but I didn't have time to add them. One of the thread's members, Peter (outapips) has coded them for all of us and now we can enjoy these new ideas that will help us on our trading. I have quite a few ideas in mind, but little by little.
The rectangle reader indicator will now display how high or how low you are in the Daily, Weekly and Monthly curves by measuring proximal lines from ONLY manual supply and demand levels drawn with the rectangle indicator. It will not detect the automatic SD levels, you will have to clone the automatic SD rectangles (explained on one of my videos) and then the RR indicator will detect the proximal lines in order to calculate percentage.
Why is this useful? Because you will be able to see at any time how close you are to your higher timeframes supply and demand areas, preventing you from selling too low or buying too high in the curve.
IMPORTANT:
You have to have both supply and demand painted, or it will show 0%
Only manual levels will work, not automatic
For demand areas your rectangles must match either DEMAND_COLOR_1, DEMAND_COLOR_2 or color.dem.retouch
For supply areas your rectangles must match either SUPPLY_COLOR_1, SUPPLY_COLOR_2 or color.sup.retouch
If you rectanglesdon'tmatch these colors then the curve percentage calculations will show 0%.
CURVE TIMEFRAME SETTINGS
These are the default values used.
show.curve.percent = true;
By default, the curve percentages will be displayed. If set to false, percentages will be hidden.
curve.display.topRHcorner = true;
When set to false, the percentages will be displayed at right bottom corner
curve.display.vertical = false;
When true overrides topRHcorner setting and display vertical from toprightcorner
curve.high = 71;
If higher than 71%, the % will be displayed in red, so you know you are quite high in the curve
curve.low = 30;
Same but if between 0 and 30%, the % will be displayed in blue. If between 30 and 71%, it will be displayed in the color set in curve.middle.color.
See curve colors below
curve.y.position = 20;
This is how high/low the % information will be displayed vertically
Find attached a screenshot of how the indicator will display how high or how low in the curve price is.
Hope you find these new features helpful.
The indicator can be downloaded from this post or from the indicators.zip in the first post. In order to install it, you need to close your Metatrader and copy it to your experts/indicator folder.
Alfonso
IMPORTANT: for any questions or problems with the indicator, please use the Rectangle Reader thread, not this thread. We don't want to have this thread covering problems with the indicators. http://www.forexfactory.com/showthread.php?t=428268
i know you mentioned working on a video for order entry. Can you give a quick explanation on how much buffer you place on zones in 4 hour trading? I know some trades will be missed, I just seem to miss quite a few by a few pips. I use 5 pips blues spread, but maybe that is too tight.
Alphonso, i know you mentioned working on a video for order entry. Can you give a quick explanation on how much buffer you place on zones in 4 hour trading? I know some trades will be missed, I just seem to miss quite a few by a few pips. I use 5 pips blues spread, but maybe that is too tight.
Ignored
The wiggle room I am using for majors are these:
5 pips for H1 levels
7 pips for H4 levels
For cross pairs:
7 pips for H1 levels
10-12 pips for H4 levels
For example:
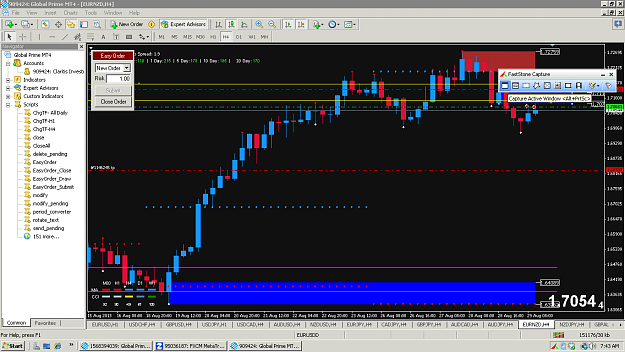
If we wanted to go short on H4 EURNZD (crosspair) and my H4 distal line is 1.7850, then our SL price will be:
1.7850 + 10 pips wiggle + 4 pips average spread
So the SL price would be set at 1.7864. Forex is a non-regulated and market markers and brokers love overshooting the levels many times, so you'd better be protected.
For longs, you don't need to add the spread to the distal line.
Hope that helps!
Alfonso
Set and Forget supply and demand trading community
I have a question, though. Does it matter if our TL is broken, even if we haven't hit a daily supply in control? Does that mean we can still take shorts?
Ignored
You are allowed to take shorts IF trendline has been solidly broken and you are not close or bouncing off original demand. Remember the loss we were talking about this morning. Many times the higher timeframes are overshoot (happens often in crosspairs) and get people buying and SLs hit.
Alfonso
Set and Forget supply and demand trading community
I've added new and important settings to the rectangle reader indicator that will help us determine how how or how low we are in the higher timeframe curves, Daily and above timeframes. I had thought of these features long ago but I didn't have time to add them. One of the thread's members, Peter (outapips) has coded them for all of us and now we can enjoy these new ideas that will help us on our trading. I have quite a few ideas in mind, but little by little. The rectangle reader indicator will now display how high or how low you are in the Daily,...
Ignored
It's not working for me for some reason.
The percentages show, but they stay at 0%, even when I've marked the zones manually.
{quote} It's not working for me for some reason. The percentages show, but they stay at 0%, even when I've marked the zones manually.
Ignored
For any questions or problems with the rectangle indicator, please use the Rectangle Reader thread, not this thread. We don't want to have this thread covering problems with the indicators. http://www.forexfactory.com/showthread.php?t=428268
You have to have both supply and demand painted, or it will show 0%
Same for everybody, ok? Or the thread will be filled with problems and not trading setups.
Alfonso
Set and Forget supply and demand trading community
{quote} The wiggle room I am using for majors are these: 5 pips for H1 levels 7 pips for H4 levelsFor cross pairs: 7 pips for H1 levels 10-12 pips for H4 levelsFor example: If we wanted to go short on H4 EURNZD (crosspair) and my H4 distal line is 1.7850, then our SL price will be: 1.7850 + 10 pips wiggle + 4 pips average spread So the SL price would be set at 1.7864. Forex is a non-regulated and market markers and brokers love overshooting the levels many times, so you'd better be protected. For longs, you don't need to add the spread to the distal...
Ignored
Thanks very much. It appears my cross pairs were indeed much too tight.
I am glad that you like it, it will helps us all a lot. But the credits don't go to me only, Peter (outapips) coded this part, I had the idea but he coded it! Thanks a lot Peter for your great work!
Alfonso
Set and Forget supply and demand trading community
Muchas gracias, for your clear presentation on your way of trading and the effort and time you put in the indicators.
Just a question about fresh and original S&D levels.
As I understand a fresh level is a level to which the current price has not yet returned to.
A original level is a level to which the price has reached an area which is not a reaction to a previous S&D Area.
How far back you look at the chart for such level,
For my view an original level could only be a all time high/low and of course we should find H4/D/W levels within each others.
Buenas dias Alfonso, Muchas gracias, for your clear presentation on your way of trading and the effort and time you put in the indicators. Just a question about fresh and original S&D levels. As I understand a fresh level is a level to which the current price has not yet returned to. A original level is a level to which the price has reached an area which is not a reaction to a previous S&D Area. How far back you look at the chart for such level, For my view an original level could only be a all time high/low and of course we should find H4/D/W...
Ignored
Buenos dias Gerald. Muchas gracias por tu mensaje
These questions are all answer of the fresh versus orignal levels video as well as the first post and other posts in the thread. Make sure you watched the videos and read the thread, I know it's long, but it's the only way to catch up with the others.
How far in time can you look for levels? As far as you need to, days, weeks, years!
Hope that solves the mystery
Alfonso
Set and Forget supply and demand trading community