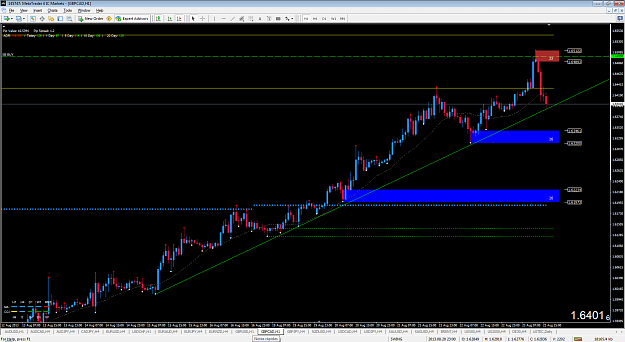
took eur aud short. Price is in weekly and daily supply. We have h4 confirmation (NEW supply). Let's wait and see... {image}
Ignored
Nice Sebastian! Missed that EURAUD short entry by a few pips, my H4 risk is set to 40 pips, the level was wider than that, so I couldn't take it. Hope it drops like a rock for you. Will be watching in case it gives another setup on Monday or later.
Alfonso
Set and Forget supply and demand trading community
Looking to short GBPCAD on fresh new H1 supply right at the extreme D1 supply area. It looks like round number 1.6500 is trying to hold. We are too high in the curve, over-extended. I had a previous loss on H4 supply, I am trying this one now. The order is set on my VPS at 1.6488.
Alfonso
Attached Image (click to enlarge)
Set and Forget supply and demand trading community
{quote} Hi Alfonso,,, isn't that H4 zone you marked as Brand new (32 pips) a reaction to an older one dated 20th of Feb at around 2 am GMT. sorry i can't provide image my set up is different than yours since i use Ninja. Thank you
Ignored
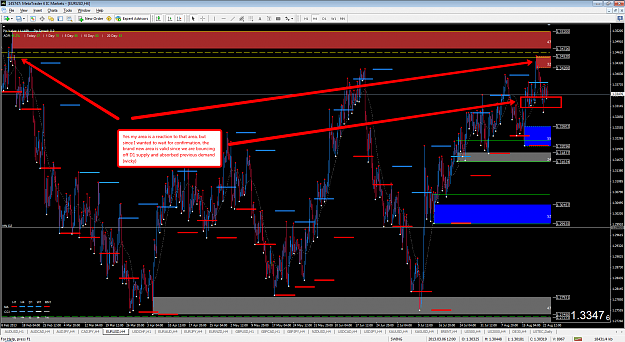
Yes my area is a reaction to that area, but since I wanted to wait for confirmation, the brand new area is valid since we are bouncing off D1 supply and absorbed previous demand (wicky).
Attached Image (click to enlarge)
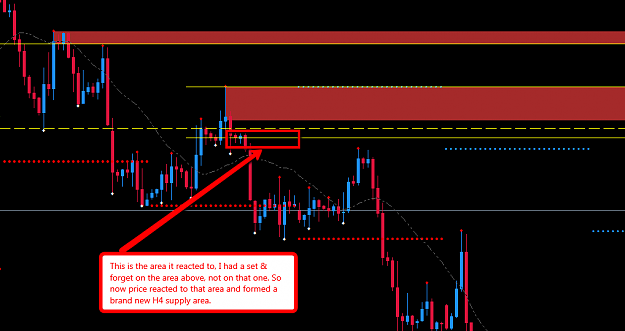
This is the source area it reacted to, I had a set & forget on the area above, not on that one. So now price reacted to that area and formed a brand new H4 supply area.
Attached Image (click to enlarge)
Alfonso
Set and Forget supply and demand trading community
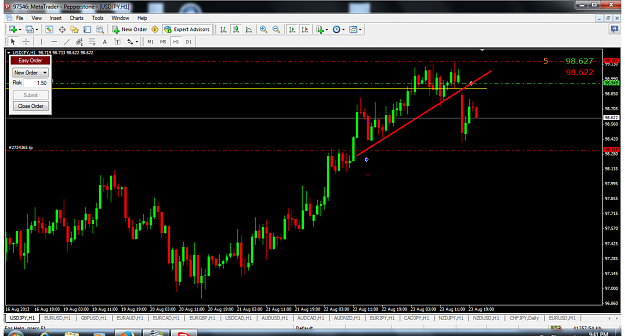
My SL on USDCAD was at 1.0285, my entry was 1.0308. Price rallied 55 pips, my SL was moved to BE because it was more than 2:1 my risk. Returned to my entry price + commission and I was kicked of the great trade! Next one
Alfonso
Set and Forget supply and demand trading community
{quote} My SL on USDCAD was at 1.0285, my entry was 1.0308. Price rallied 55 pips, my SL was moved to BE because it was more than 2:1 my risk. Returned to my entry price + commission and I was kicked of the great trade! Next one Alfonso
Ignored
Hi Alphonso,
Have you done a study of not moving stops vs moving stops. Maybe its best not to move stops , Especially if your stops sre so tight
{quote} My SL on USDCAD was at 1.0285, my entry was 1.0308. Price rallied 55 pips, my SL was moved to BE because it was more than 2:1 my risk. Returned to my entry price + commission and I was kicked of the great trade! Next one Alfonso
Ignored
Thank you. I'm still learning a lot and you guys here are fantastic.
And now for the reason why did I asked about stop loss...
Based on your trading history (experiance) what is better setup on the long run: tighter stop and higher RR or wider stop loss and RR 1,5:1 or even 1:1.?
This trade would made profit if there was slightly wider SL with 1,5:1 risk-reward ratio.
{quote} Hi Alphonso, Have you done a study of not moving stops vs moving stops. Maybe its best not to move stops , Especially if your stops sre so tight
Ignored
If price is trending well and your supply/demand zone was solid, it should not move back to the area after already moving 2:1 away.
if it moves back, usually something was done wrong or market dynamics changed.
Look at EURUSD the past couple of days. That is a good example.
and there will always be other opportunities. Capital preservation is #1.
Looking to short GBPCAD on fresh new H1 supply right at the extreme D1 supply area. It looks like round number 1.6500 is trying to hold. We are too high in the curve, over-extended. I had a previous loss on H4 supply, I am trying this one now. The order is set on my VPS at 1.6488. Alfonso {image}
Ignored
Hi Alfonso,
Thumbs up for the good work you are doing here. I am new on the SD trading system and I can see you have gone far on this thread. I want your advise on the areas to concentrate in order to fastrack and catch up with you guys.
{quote} Thank you. I'm still learning a lot and you guys here are fantastic. And now for the reason why did I asked about stop loss... Based on your trading history (experiance) what is better setup on the long run: tighter stop and higher RR or wider stop loss and RR 1,5:1 or even 1:1.? This trade would made profit if there was slightly wider SL with 1,5:1 risk-reward ratio.
Ignored
Hi Blackbox!
Not interested in 1:1 or 2:1 take proftis. If I pull the trigger is because I aim to get a minimum of 3:1 or more. If you aim 1:1 on your trades, you will most likely blow up your account, you'd need a very high accuracy on your trades.
I am not interested either in feeding my ego with a 90% success ratio, 40-50% is more than enough for me or anybody IF your target is at least 3:1, else you will blow up your account.
I am trading not to be a 90% accurate trader, but to earn money and enjoy life! My ego has been punnished and it's now in the background. Sometimes it pops up but I kick him in the ass as soon as I realized
Alfonso
Set and Forget supply and demand trading community
{quote} Hi Alphonso, Have you done a study of not moving stops vs moving stops. Maybe its best not to move stops , Especially if your stops sre so tight
Ignored
Hi Ash!
I've been working very hard lately doing lots of forward testing and backtesting, and yes it's better not to move stop loss to breakeven too soon when you are in higher timeframe areas and you expect a nice bounce or reversal, 4-5 to 1 would be ideal or when an important opposing area has been taken out. Price needs breathing room. The only thing that stops most of us from doing it is the false feeling that we're safer with a breakeven and the fear to losing the trade... but then see what happens. In September I will be adding some changes to my trading plan, one of these changes is letting the trade run with no breakeven.
As far as the SL is concerned, that's one of the best things about SD trading, it's laser accuracy for entry and stop loss. They are low $ risk entries with tight sloss, you don't need to think much. Entry 1-2 pips off the proximal line, SL 5-10 pips off the distal line. I do always the same, whatever happens happens!
This is great because you will ALWAYS be doing the same thing, it will become a habit, a routine, a mechanical way of trading, and to me that's KEY to success.
Will I lose some trades because of the tight stop loss? Yes, many. But that's fine as long as follow my trading plan's rules, don't you think?
Alfonso
Set and Forget supply and demand trading community
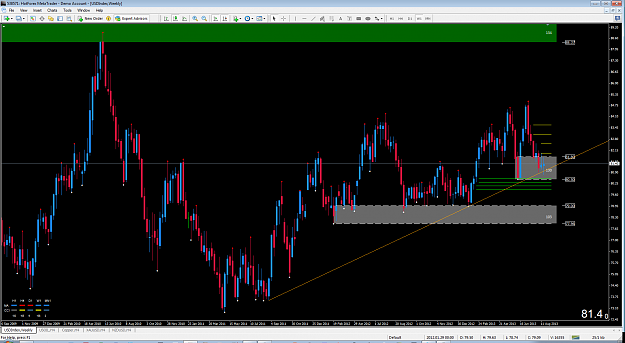
Hey guys, Here is a look of USD Index chart. We can see on Daily chart that price is compressing. Will it break the current supply area? Well if it does, it could go to the next one higher. {image} Weekly chart: We can see that we are in a uptrend, will it break it down? I'm sceptical for now. {image} My view is bullish on USD for now. What you guys think of it? feel free to comment. Alfonso, if you think it's not appropriate, dont hesitate to tell me, but I think it's good to know what's going on with USD Index when we trade USD crosses pairs....
Ignored
Hi Mfinab!
I agree with you, it's totally appropiate. I've mentioned it quite a few times on the thread. The $index is key to forex trading. I always have 2 metatraders running on my desktop, my live metatrader and then HotForex demo account, the one I can see the $index since I don't have it on my live broker!
Nice job!
Alfonso
Set and Forget supply and demand trading community
dear panoramia, could you please post supply and demand area for EJ..would like to see your analysis in this pair..thanks a lot
Ignored
Hi there!
My MT is down now, I think my eurjpy template is updated. Instead of posting the charts, I've decided this time to share the .tpl file with you. Load it and let me know if you have any questions ok?
Thanks a lot for contributing to the thread!
Alfonso
{quote} Hello Alfonzo, First post here at this great thread. I am a longtime VSA trader but just new into the whole S/D zone trading. I have been spending time watching Sam's video's as well as yours and reading through the thread. I have also spent some time at the Ace and RTM forums as well as the PIE thread from here at FF trying to soak it all in. I like your robotic way of going about taking your trading and setting your zones, emotionless and straight to the point. I am watching for the same EU short that you mention in the quoted post. See...
Ignored
Hi Pres!
Thanks for your message and contribution to the thread, I appreciate that.
As far as the lower H4 demand area on the EURUSD, I always take the whole basing are, in this case the blue candle with the closing price. I always tend to draw the zones like that. Another thing is my "risk tolerance" on EURUSD H4 charts. I won't take a level which is +40 pips on H4. What will I do? I will drill it down to a fix number of pips. But I like to have the levels painted always the same way, because by doing so I'm being mechanical and methodical.
If I were to take that long on eurusd, I would drill it down to that same spot you drew yours. Why? Because it matches last week low (those red beads on my charts show last week low), it's a confluence, it's also at the D1 demand area, but too much trading in the zone prior to that, as well as the $index at an important weekly demand area. If we start bouncing off that area on the $index, that H4 demand on the eurusd won't hold much, too much trading in the zone... but that's another thing...
The thing is that I will always draw the zones taking into account the basing area, I will drill the area down to a fix number of pips. 30 pips on H1 and 40 pips max on H4. If I drill it to 40 pips on H4, I will need 3:1 R/R ratio for my take profit or I won't take the trade at that zone. This is all done automatically at my vps with a personal ea I've built for personal use only, that's why I like having the orginal areas painted, because my ea will drill it down to my maximum risk tolerance and adjust my entries to 1% of my equity at the entry moment.
Hope that makes sense! And thank you again for your contribution.
Alfonso
Attached Image (click to enlarge)
Set and Forget supply and demand trading community
{quote} Hi Alfonso, Thumbs up for the good work you are doing here. I am new on the SD trading system and I can see you have gone far on this thread. I want your advise on the areas to concentrate in order to fastrack and catch up with you guys. Thanks. Kindest regards, Boylan.
Ignored
Hi Boylan!
My warmest welcome to the thread!
What to do to catch up with us? Start with Post #1. Read it a couple of times, understand it. Then watch all the videos on first post as well as the webinars. Then the whole thread. That will take some time, BUT it's the only way to catch up with what we're presenting here.
One last thing... lots of patience and screentime... it's the only way!
My warmest regards!
Alfonso
Set and Forget supply and demand trading community
Joined Sep 2010
|
Status: I'm not here... or am I?
|4,000 Posts
Alfonso,
Thanks so much for the warm welcome.
If I may ask what is your view on Gold?
Monthly we have found support at a speedbump and are about 50% between the indi drawn blue fresh D and red fresh S.
Weekly we have hit a fresh demand and bounced (lovely touch trade in hindsight). Again we are mid way between fresh S and fresh D. I see that we had higher demand zone that was cleared on that spike down that started a series which was a RDB, DBD (base in the orange rectangle) that was a key base that led to 2 red support engulfs. Whe are in this zone now.
Daily we can see a non fresh demand zone below that was touch shortly after creation right within the weekly zone from the previous chart so demand at demand and this trade would have been a no brainer long IMHO (sorry if this trade was already covered on the thread but it is too lovely not to mention). On the way up we printed a swing high right at a previous red support line before falling down to a base from a RBD. From this base we see a RBRBR. The second to last base is now key for me as it took out that blue resistance line...
How would you trade that fresh daily supply zone? Would you even trade it based on all the other factors? Would this be a set and forget or would you need confirmation. Would that white box zone cause you any concern. IMHO the fresh supply zone holds more weight than the demand bases because it lead to two support lines being broken.
Many thanks for any time you spend answering this post and I hope you are having a great weekend.
Alfonso, Thanks so much for the warm welcome. If I may ask what is your view on Gold? Monthly we have found support at a speedbump and are about 50% between the indi drawn blue fresh D and red fresh S. Weekly we have hit a fresh demand and bounced (lovely touch trade in hindsight). Again we are mid way between fresh S and fresh D. I see that we had higher demand zone that was cleared on that spike down that started a series which was a RDB, DBD (base in the orange rectangle) that was a key base that led to 2 red support engulfs. Whe are in this...
Ignored
Hi pres78
I was analizing gold too, and i think, the same as you, thak we can expect a drop from weekly and daily supply levels. I always wait for confirmation on lower tf like h4 or h1, for 2 reasons: first, more important, i don't have a lot of experience to know if the s or d level is fresh or is it a reaction from another s or d level. Second reason, confirmation (breaking the trendline and retest of fresh s or d zone on lower tf ) gives me possibility to tighten my sl level, so my RR will be a lot better.
White box zone on your chart is a speedbump, so if we will have reaction from weekly supply area, i think that this level will be broken. But, as i said, i am still learning, and i will be waiting for what Alfonso is thinking about gold
{quote} Hi pres78 I was analizing gold too, and i think, the same as you, thak we can expect a drop from weekly and daily supply levels. I always wait for confirmation on lower tf like h4 or h1, for 2 reasons: first, more important, i don't have a lot of experience to know if the s or d level is fresh or is it a reaction from another s or d level. Second reason, confirmation (breaking the trendline and retest of fresh s or d zone on lower tf ) gives me possibility to tighten my sl level, so my RR will be a lot better. White box zone on your chart...
Ignored
The lower orange rectangle you have marked is not a supply zone, as the candle you have marked has not taken out any previous demand zones.
same with the rectangle above it.
im not at my computer at the moment, but I will post a chart once I get back.
Alfonso, Thanks so much for the warm welcome. If I may ask what is your view on Gold? Monthly we have found support at a speedbump and are about 50% between the indi drawn blue fresh D and red fresh S. Weekly we have hit a fresh demand and bounced (lovely touch trade in hindsight). Again we are mid way between fresh S and fresh D. I see that we had higher demand zone that was cleared on that spike down that started a series which was a RDB, DBD (base in the orange rectangle) that was a key base that led to 2 red support engulfs. Whe are in this...
Ignored
Hello Pres!
Let me give you my view on GOLD. It's just my view, based on the strict rules I am using for supply and demand. I want to do always the same, so this analysis is based just on that view.
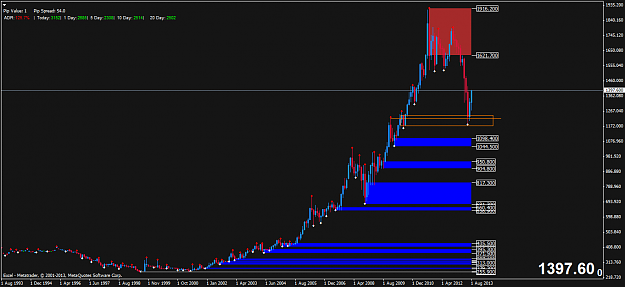
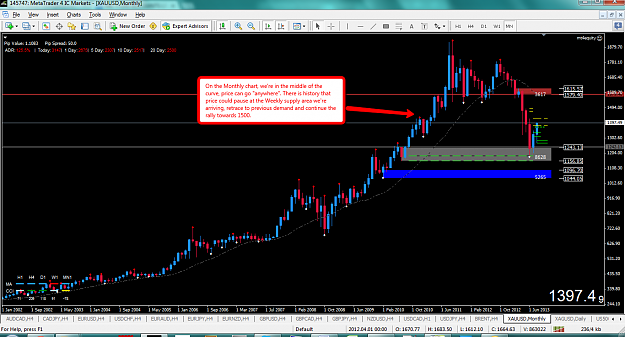
MONTHLY CHART
On the Monthly chart, we're in the middle of the curve, price can go "anywhere". There is history that price could pause at the Weekly supply area we're arriving, retrace to previous demand and continue the rally towards 1500.
Attached Image (click to enlarge)
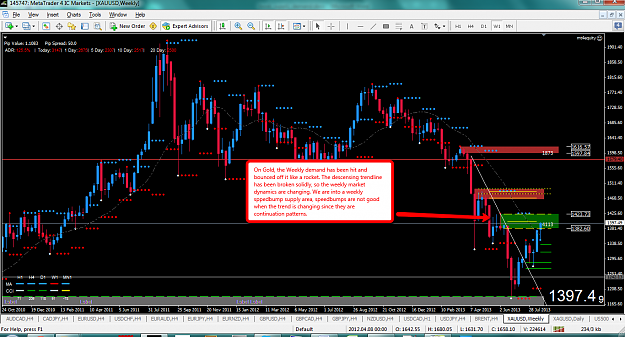
WEEKLY CHART
On Gold, the Weekly demand has been hit and bounced off it like a rocket. The descensing trendline has been broken solidly, so the weekly market dynamics are changing. We are into a weekly sppedbump supply area, speedbumps are not good when the trend is changing since they are continuation patterns.
Attached Image (click to enlarge)
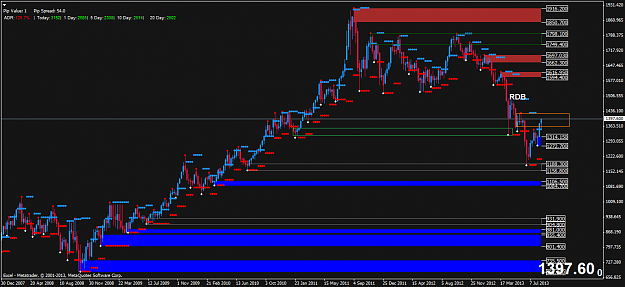
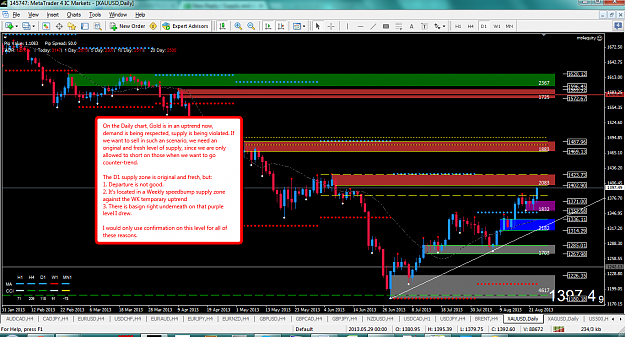
DAILY CHART
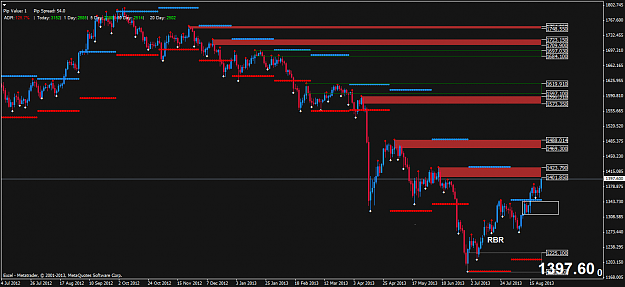
On the Daily chart, Gold is in an uptrend now, demand is being respected, supply is being violated. If we want to sell in such an scenario, we need an original and fresh level of supply, since we are only allowed to short on those when we want to go counter-trend.
The D1 supply zone is original and fresh, but:
Departure is not good
It's located in a Weekly speedbump supply zone against the WK temporary uptrend
There is basign right underneath on that purple level I drew.
I would only use confirmation entry on this level for all of these reasons.
Attached Image (click to enlarge)
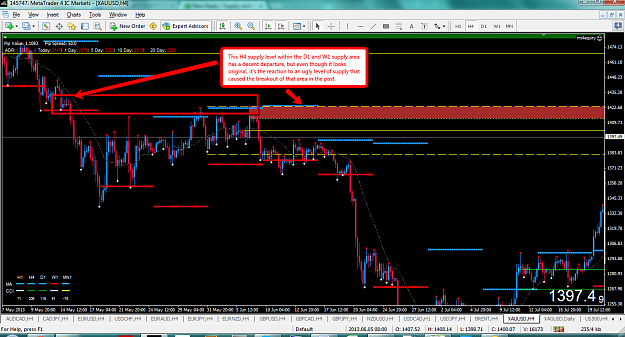
H4 CHART
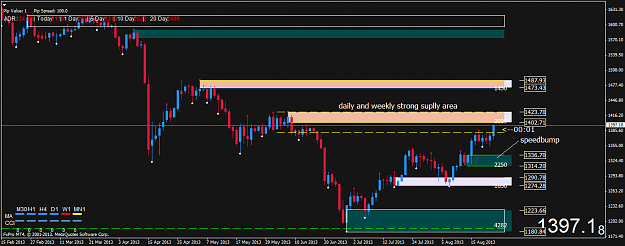
This H4 supply level within the D1 and W1 supply area has a decent departure, but even though it looks original, it's the reaction to an ugly level of supply that caused the breakout of that area in the past.
Attached Image (click to enlarge)
My conclusion is that I will only take confirmation trades on that area. That H4 supply area could work, but I am leaning on the higher timeframe topdown analysis to conclude I just want to take confirmation trades on that area.
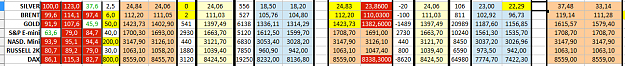
This is also when the supply and demand level spreedsheet I use comes handy. Take a look at what it says for us on Gold, as well as in other related instruments. Exactly what we're describing. Middle of the curve for the Monthly, oversold in Weekly/D1 supply.
Attached Image (click to enlarge)
Hope my analysis makes sense to you and Sebastian, who also posted his view.
Alfonso
Set and Forget supply and demand trading community
{quote} Hello Pres! Let me give you my view on GOLD. It's just my view, based on the strict rules I am using for supply and demand. I want to do always the same, so this analysis is based just on that view. WEEKLY On Gold, the Weekly demand has been hit and bounced off it like a rocket. The descensing trendline has been broken solidly, so the weekly market dynamics are changing. We are into a weekly sppedbump supply area, speedbumps are not good when the trend is changing since they are continuation patterns. {image} DAILY CHART On the Daily chart,...
Ignored
alfonso,
how are those two red zones valid supply levels on the daily chart? None of them have broken any demand levels.
and the first red supply zone is not fresh. It was touched almost instantly after departure.