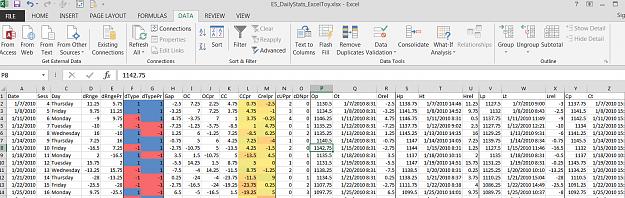
Hi, presently I am manually inputting these data in Excel. I am wondering if the followings are possible to create?
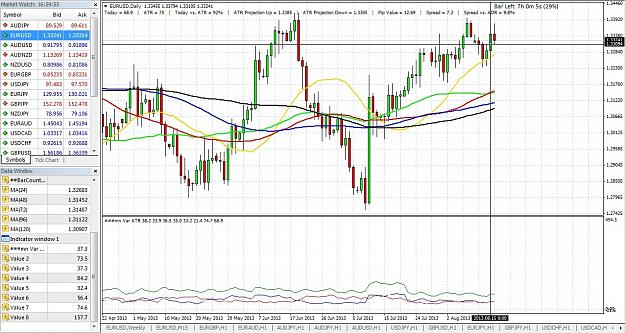
1. A dashboard of these information in Chart
2. A dashboard in an Indicator Window.
3. A moving line in an Indicator window visibly like MACD, ATR, RSI, STOCH, etc.
Criteria of indicator settings may include:
1. An Indicator of the values with choice of selection to apply a specific TF visibly on another different TF.
2. MA average of last X candles with constant/fixed Y TF.
3. Etc....
Thanks in advance for any guidance.
Attached Image (click to enlarge)
The only winner is the one who survive the longest...