Here are some unique indicators that I made for ninjatrader. Try it out if you have any free time and want to play with a useful tool.
Import by going to files->utilities->import ninjascript.
Enjoy!
This post contains the most recent indicators that I've made. Don't download the other indicator in this thread, its old, i couldn't delete it.
In order to use, draw a fibonacci circle and change the tag to whatever is in the tag parameter for the fibsr or amazin'arc indicator.
note: Thanks Invicta! I highly recommend everyone to get the book unlocking wealth secret to market timing (by john crane), its amazing! The PivotSwing draws pivot points as blocks.
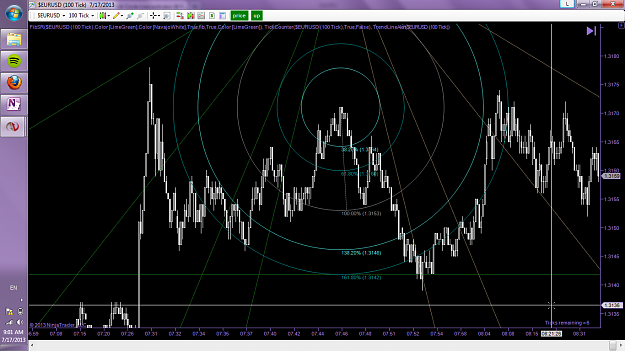
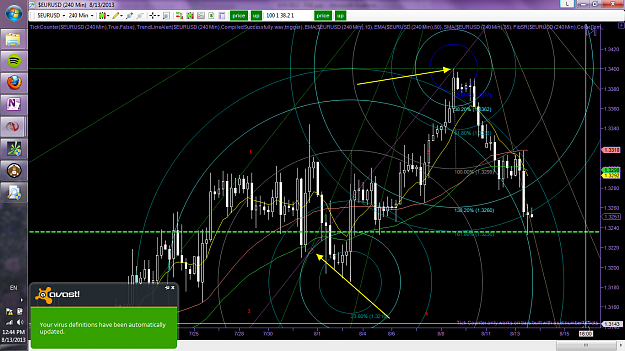
Also, if i may say so. Isn't she puuuurty! The amazing arc? Transparency effects really make it visually appealing, even if we have the 270 arc and the extended grid!
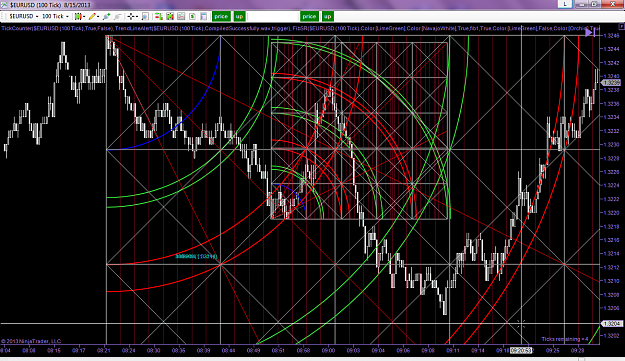
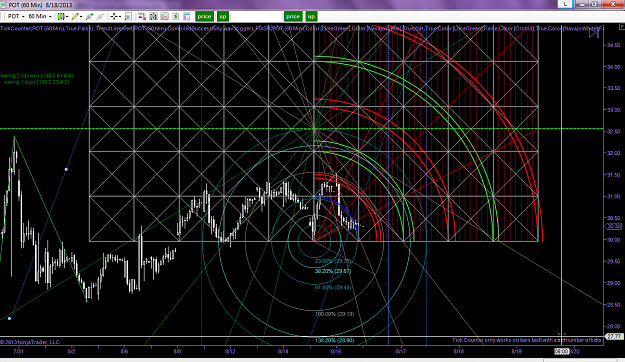
amazing arc and pivot swing dot indicator
note: dots are drawn atleast two bars after the dot you see, if price is uber flat it may be 3 or 4 bars. However, no dots are erased once they are shown.
the amazing arc will draw a button on the toolbar. Click that, and type in a number for an arc (0 is the blue arc, 1 is the first red, 2 is the second green, 3 is the second red, 4 is the second green, and 5 is the third red)
When price reaches the arc, or is inside the two arcs, an alarm will go off (one short noise), after that the alarm will turn 'off.' If you enter an invalid number, the alarm will stay 'off'.
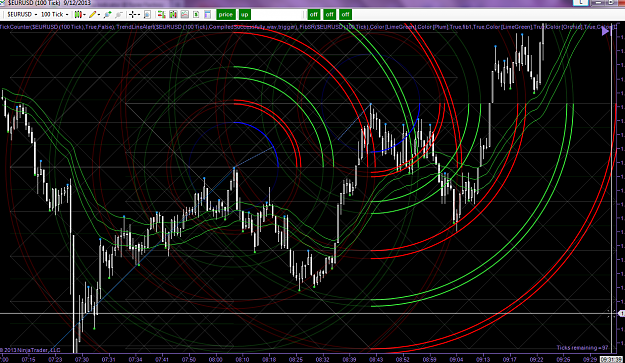
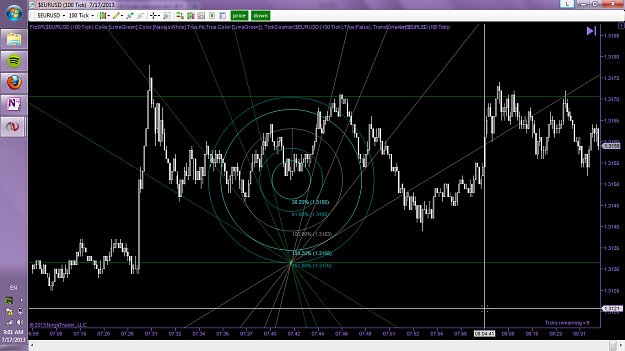
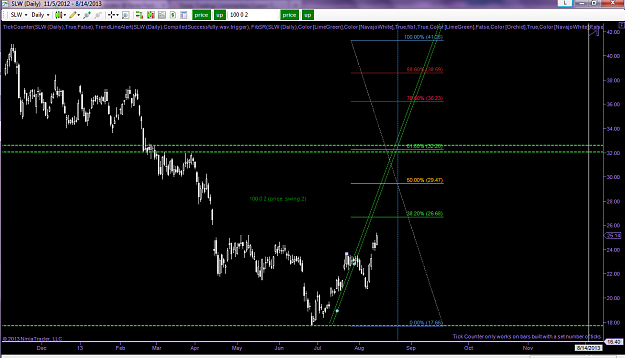
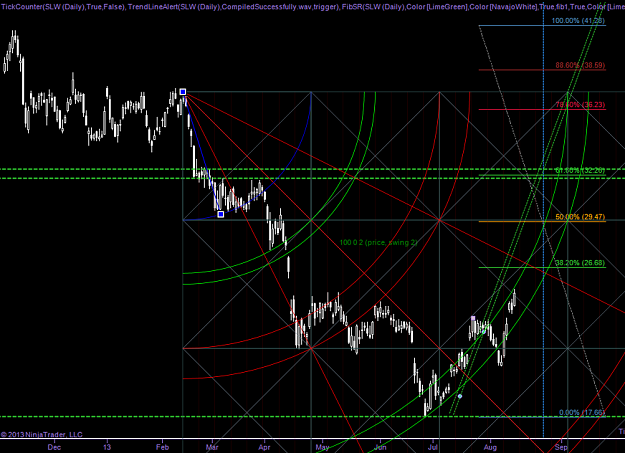
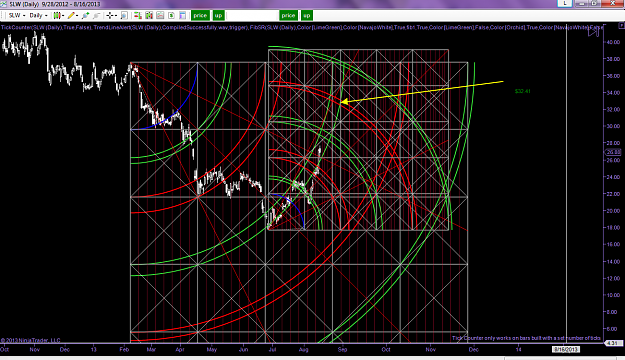
fibsr
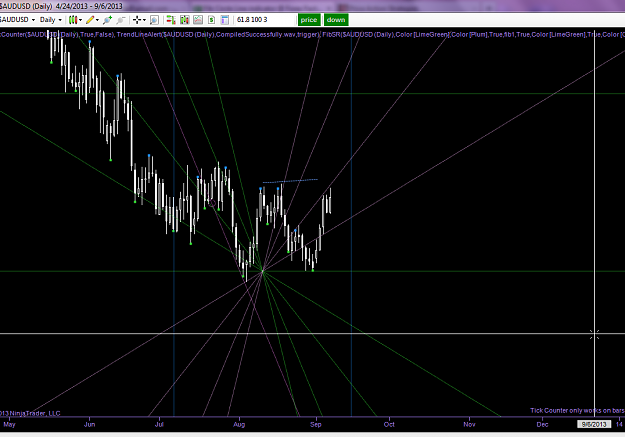
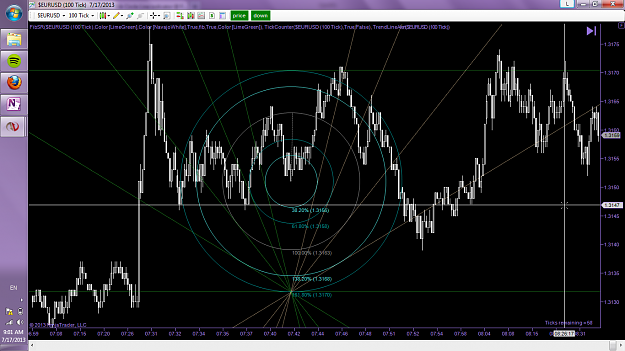
Circle Contours
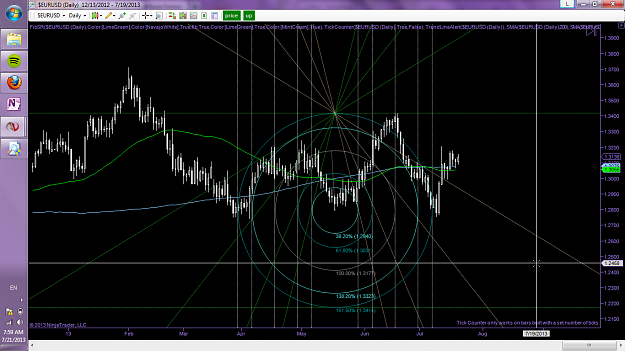
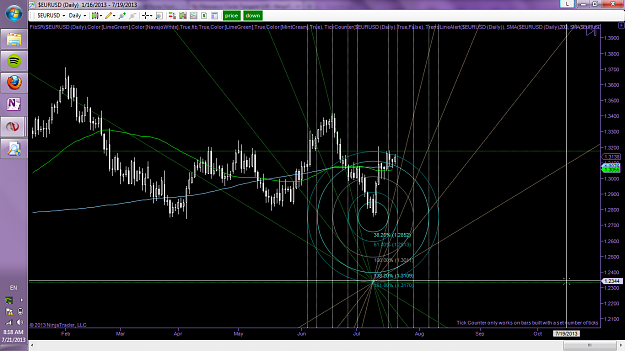
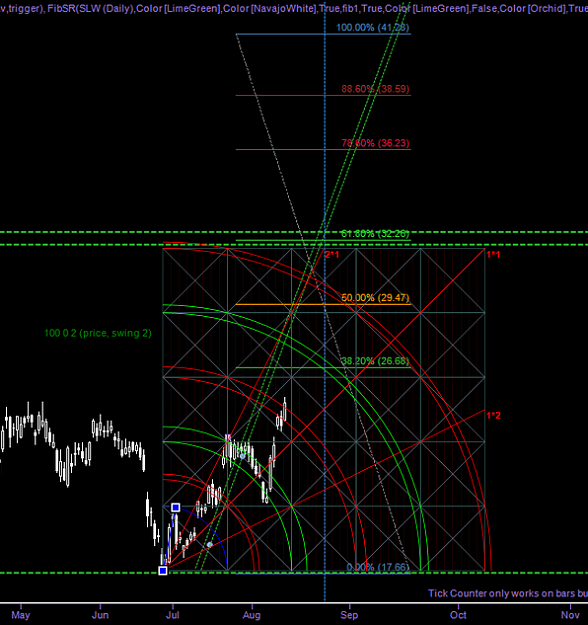
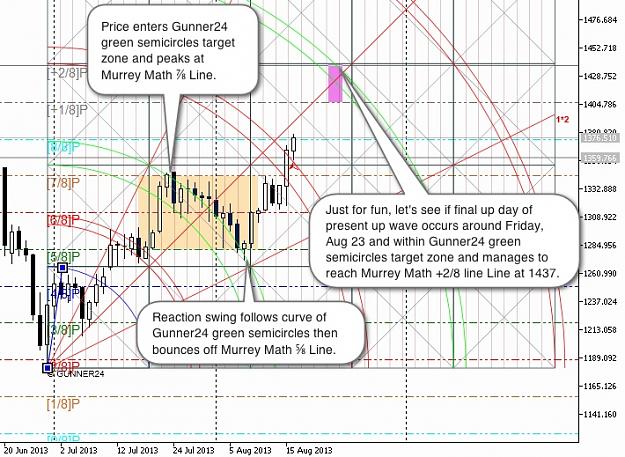
The circle contour indicator looks at your chart and locates three lines of a 'palegreen' color. When it finds this, it draws three contours. The outer palegreen contour is the intersection of circles which start from the swing startpoint to the end. The limegreen contour is the intersection of circles which start from the swing startpoint and go 2/3 of the way to the end. Finally, the red contour is 1.5/3 the way.
If you dont see a limegreen or red, it is because there was no area of price where price was 2/3 the way from all swing start points (or 1/3).
Therefore, in a way, the contours you see are 'points' on the chart.
If you dont see a palegreen contour, it is either because you do not have 3 swings (you need exactly 3 palegreen swings), or it is because they are too far apart (which can only happen if the swings are not consecutive/near consecutive.
There is one small bug where you will see what seems like 4 arcs in th epalegreen contour, this is because the 'intersection' function isnt perfect, but this wont distract from everything.
Circle contours are meant to be used with the amazingarc tool in order to determine how far to expand the amazingarc to locate the end of the swing before it happens. Also, its really fun to play with!
Hope you enjoy and comments are welcome (constructive onnes)!
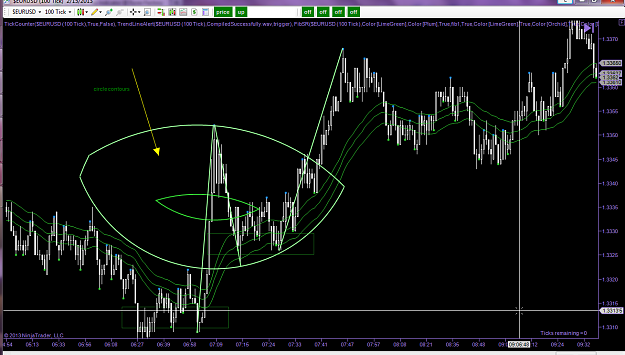
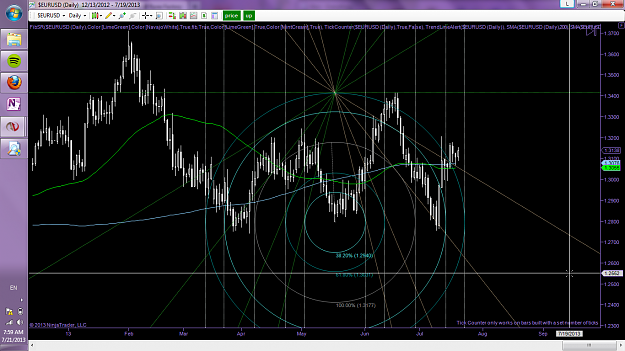
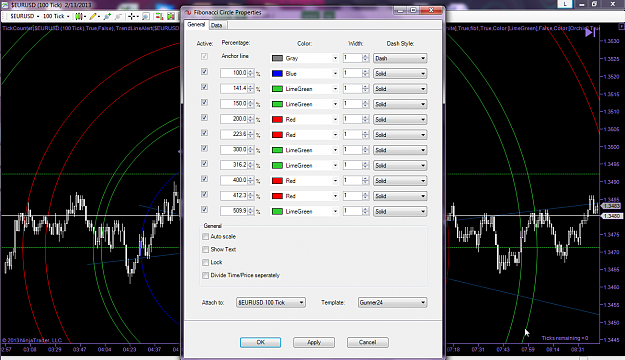
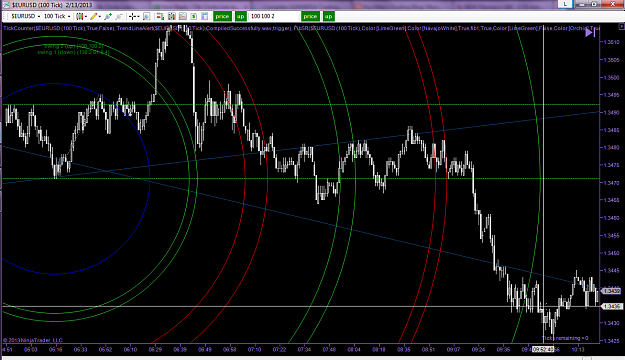
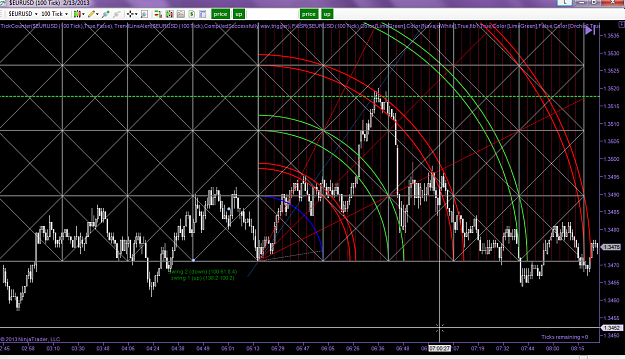
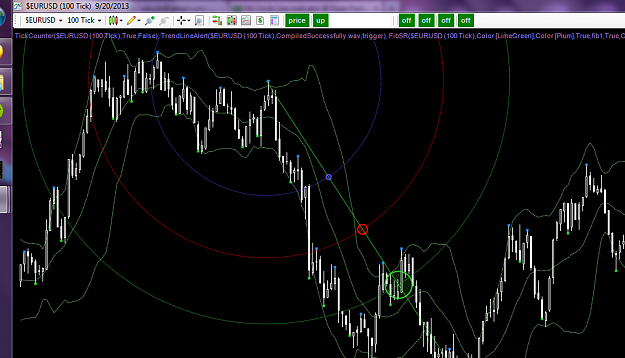
Bubble
Draws a red and green and blue circle on each line of the specified color and width, corresponding as shown in the picture. the circles correspond to the first three arcs of the amazingcircle
Import by going to files->utilities->import ninjascript.
Enjoy!
This post contains the most recent indicators that I've made. Don't download the other indicator in this thread, its old, i couldn't delete it.
In order to use, draw a fibonacci circle and change the tag to whatever is in the tag parameter for the fibsr or amazin'arc indicator.
note: Thanks Invicta! I highly recommend everyone to get the book unlocking wealth secret to market timing (by john crane), its amazing! The PivotSwing draws pivot points as blocks.
Also, if i may say so. Isn't she puuuurty! The amazing arc? Transparency effects really make it visually appealing, even if we have the 270 arc and the extended grid!
amazing arc and pivot swing dot indicator
note: dots are drawn atleast two bars after the dot you see, if price is uber flat it may be 3 or 4 bars. However, no dots are erased once they are shown.
the amazing arc will draw a button on the toolbar. Click that, and type in a number for an arc (0 is the blue arc, 1 is the first red, 2 is the second green, 3 is the second red, 4 is the second green, and 5 is the third red)
When price reaches the arc, or is inside the two arcs, an alarm will go off (one short noise), after that the alarm will turn 'off.' If you enter an invalid number, the alarm will stay 'off'.
Attached Image (click to enlarge)
fibsr
Attached Image (click to enlarge)
Circle Contours
The circle contour indicator looks at your chart and locates three lines of a 'palegreen' color. When it finds this, it draws three contours. The outer palegreen contour is the intersection of circles which start from the swing startpoint to the end. The limegreen contour is the intersection of circles which start from the swing startpoint and go 2/3 of the way to the end. Finally, the red contour is 1.5/3 the way.
If you dont see a limegreen or red, it is because there was no area of price where price was 2/3 the way from all swing start points (or 1/3).
Therefore, in a way, the contours you see are 'points' on the chart.
If you dont see a palegreen contour, it is either because you do not have 3 swings (you need exactly 3 palegreen swings), or it is because they are too far apart (which can only happen if the swings are not consecutive/near consecutive.
There is one small bug where you will see what seems like 4 arcs in th epalegreen contour, this is because the 'intersection' function isnt perfect, but this wont distract from everything.
Circle contours are meant to be used with the amazingarc tool in order to determine how far to expand the amazingarc to locate the end of the swing before it happens. Also, its really fun to play with!
Hope you enjoy and comments are welcome (constructive onnes)!
Attached Image (click to enlarge)
Bubble
Draws a red and green and blue circle on each line of the specified color and width, corresponding as shown in the picture. the circles correspond to the first three arcs of the amazingcircle
Attached Image (click to enlarge)
Attached File(s)