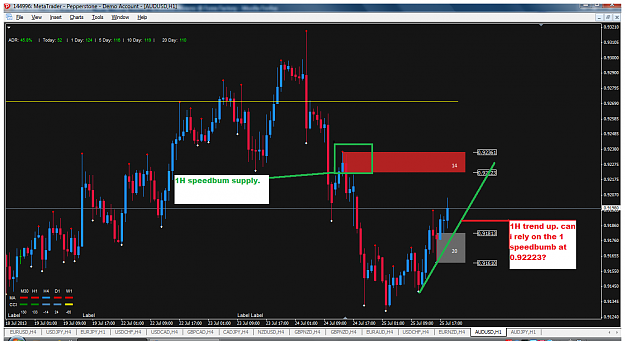
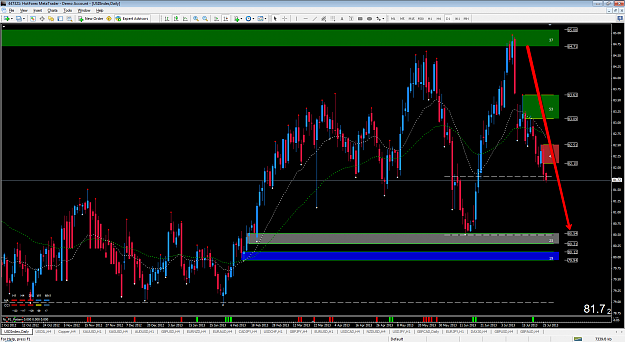
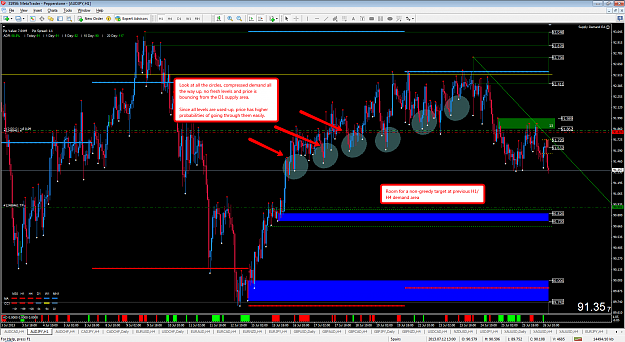
Disliked{quote} Thanks for the help on that chart. I had a few questions? 1. I am looking at your D1 supply level for AUD/JPY and mine is a little different. could you please show me a snapshot where you painted your daily supply level for the AUD/JPY 2) The chart below is the AUD/USD and i have a speedbump supply level on the 1H chart. The trend was down and and the 1H trend is UP. When looking at the 1H chart and the trend is reversing: making higher highs and lower lows, can i rely on that 1H speedbump supply that i have painted? 3) could you please...Ignored
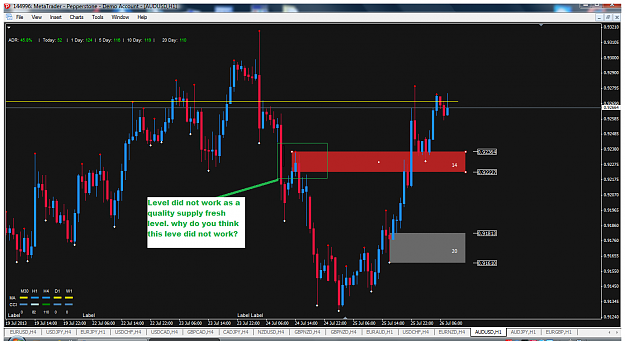
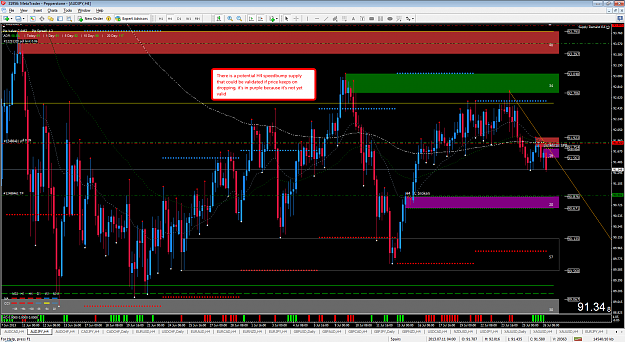
Just a quick question, on the A/U chart you posted is that supply zone you highlight in the green box correctly named as a "speedbump"? Is it not in fact a (fresh and original) rally-base-drop instead? Furthermore, it was formed after the red extended range candle crashed through the previous demand zone (sometimes referred to as a "swap" zone on some other threads). In your experience, can you expect this kind of zone to be strong? In forming the R-B-D supply zone, can it be argued that price has already had the opportunity to remove excess supply created by trapped traders who were positioned long at the previous demand zone, and perhaps may be weaker as a result? Your thoughts and experience would be appreciated.
Huk