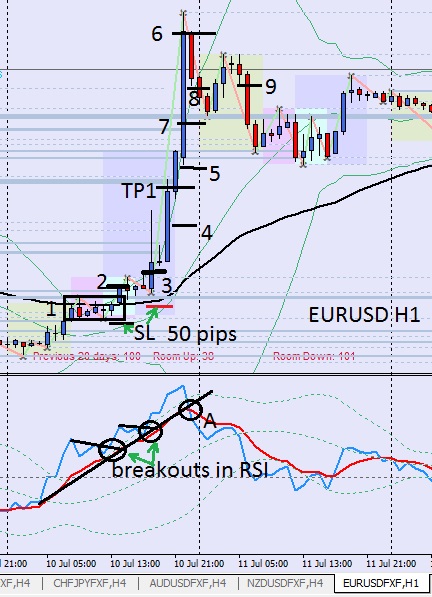
After a period of consolidation (1), we can enter a buy order in (2), with a stoploss below the support (50 pips). We can enter at (3) too, putting our stoploss below the EMA 55 (50 pips). Note the breakouts at RSI trendlines.
First target is marked "TP1" in chart. From point (2) is a potential profit of 120 pips (ROI > 2:1) or from point 3 the profit could be 100 pips (ROI 2x1).
Things go well and price hits the TP1 point.
So we have to make a choice. We can:
Close the entire trade at TP1;
Manage all this trade from this point;
Alternativelly, we can close half lot and manage the other half.
Lets do this for educational purposes. We close half lot and move the stoploss to ... where?
My choice would be the point (4). There are some support lines there. Anyway, this candle is very big to consider put SL only at its bottom.
But trade continues and next candle breaks the significant resistance level. We can now move your SL to TP1 point. It is near bottom of candle and is below the strong line that now is a support.
The next candle is a very very big one and yet before it closes, we move our SL to point (5). With the close, we move the SL to (7), below the strong line that now is a significant support.
Wow! From point (2) to point (6) we got 340 pips! We surely are very happy with this result and in a good moment we close the trade.
But maybe we are not in a very good moment and decided get more from the market, hum? We am only viewing $$$$$$$$ and already thinking in buy a new car or house.
So we see the red candle forming, and when it closes we move the SL to point (8), some pips below the bottom of the candle.
In the next candle we are stopped for a profit of 240 pips. Fantastic!
But wait...maybe we are in those days where we are thinking we know to where the market is going. And in our imagination, the market is going up and up forever. We are 100% sure about this! It is sad, but happens frequently we have this kind of illusion.
So we dont close the trade and see price testing the support line and - for our happiness - go up again. "I knew it!"... we think. It is a lucky day and we follow the blue candles again only to get stopped (if we are using the bottom candle method to move our SL - what I recommend) in point (9). Note that point (8) and point (9) are pratically equivalent. Very good, but the story could be different.
Note that (8) corresponds to the moment in point (A), at iw, where RSI crosses below EMA 8 and below upper BB, suggesting the closing of the trade.
enter sell when rsi crosses the ema 8 from above and even safer when both the price bar went outside boilinger band in the main window and the rsi went outside the band in the indicator window and comes in boomchakalaka 220pips up
Attached Image (click to enlarge)
we DONT know where price will go the next second so trust your indicator
{quote} enter sell when rsi crosses the ema 8 from above and even safer when both the price bar went outside boilinger band in the main window and the rsi went outside the band in the indicator window and comes in boomchakalaka 220pips up {image}
Ignored
A good example of Trade B setup.
Well done, cheataddict!
Attached Image (click to enlarge)
About trade management, I could move my SL to 1,2,3 and 4 if I have the opportunity. And if I could control my anxiety lol.
I was testing an EA and forgot to change to another demo account. It opened a buy order USDCHP at the wrong time and now I'm trying to do damage control.
P.S. - Uff! I succeed in close this trade with a 6 pips profit.
a) Watching that previous daily candle (arrow), I could be afraid to enter a sell order, but I can see weakness in two double tops with wicks (1) and (2), and in the significant resistance line (3).
b) Yet about trade management:
If I always use the "bottom/top of candle trailing stop method" to move my SL, and only wait be stopped, I will lose half profit here.
Same thing if I wait for RSI/EMA crossing. My profit could be about 17 pips, not 32.
So, if a have time and patience, I prefer watch the support/resistance lvls and see what price is doing near those levels, and act accordinly. Frequently I just get out with the profit if I see some indecision.
So I use and recommend the "bottom/top of candle trailing stop method" (see post #22), but I can exit anytime if I see weakness.
Sure, I can miss some great movements with this, but the opposite is more frequent and I think "Thanks God I closed in time".
I can change my mind any time, but this is how I am doing and thinking in the moment. I am open to other approaches and ready to listen you, friends.
Anyway, if at the end of this chart (see above) a good movement starts, I can always take it if there is a good setup, but this is another trade and another history.
I am looking 12 pairs atm and the situation seems quite unpredictable.
Attached Image (click to enlarge)
See EURUSD, for example.
Going up, there are those wicks and resistance at 1.3173.
Going down, there is that very very big daily candle (10.07.2003) saying ... "hey, ppl, here is bull territory!".
I could take the trade in (1) but where place my stoploss? the previous candle invalidated good places and my ROI is not good.
On post#1 you recommend the use of two timeframes (H1/M15). But I see no reference to the M15 timeframe throughout the thread. Did you quit using M15 timeframe for entries?
You can see in post #2 that I entered trade 3, what it is a bad "Trade C setup".
Then I realized that using M15 charts I could adjust my entries.
See in post #16 that I used M15 charts to ilustrate my "discovery". (Of course a million ppl said this before me, but only now I am incorporating this in my practice.)
Since then I am using an indicator called "Minichart", that you can find attached in my post #1 and it is in my template too.
Ocasionally I change my timeframe to D1 or M15, but mostly this indicator is enough to me.
And yes, now I am always watching M15 before entries.
Hello and welcome, onlyghost! You can see in post #2 that I entered trade 3, what it is a bad "Trade C setup". Then I realized that using M15 charts I could adjust my entries. See in post #16 that I used M15 charts to ilustrate my "discovery". (Of course a million ppl said this before me, but only now I am incorporating this in my practice.) Since then I am using an indicator called "Minichart",...
10 trades in Trade Explorer, and until now I have a nice "stair" chart. {image} Well, it have only 3 days. Let's see how it goes in the next days and weeks.
Ignored
Hello Alex,
Nice to see a brazilian member starting a promising topic here.
Are you trading for real in another account?
{quote} sorry i replied late for now it s still open did d indy give draw your attention to any good trade today
Ignored
My last entry was in AUDUSD (see post #26). All day I tried get out of a trade opened by an EA in USDCHF (My mistake. I forgot of change to another account to test the EA). Luckily I got success.
About the BandR2 indicator, I am not using it because I trade 12 pairs and the audio alert sometimes is very tiring.
Also the touch of BB can be or not significant, depending of the other elements involved.
Anyway the indy is very interesting and can be used by who trades one pair, or pairs without direct correlation, so you can trade without have many simultaneous audio alerts.