Hi everyone,
The latest Commitments of Traders review is out (here).
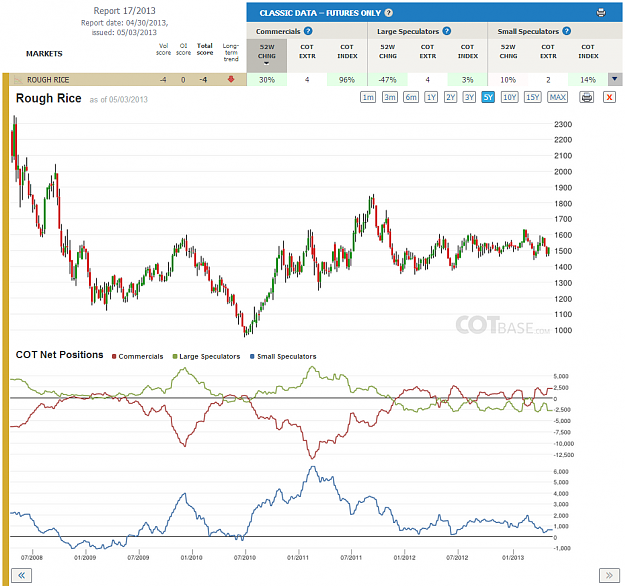
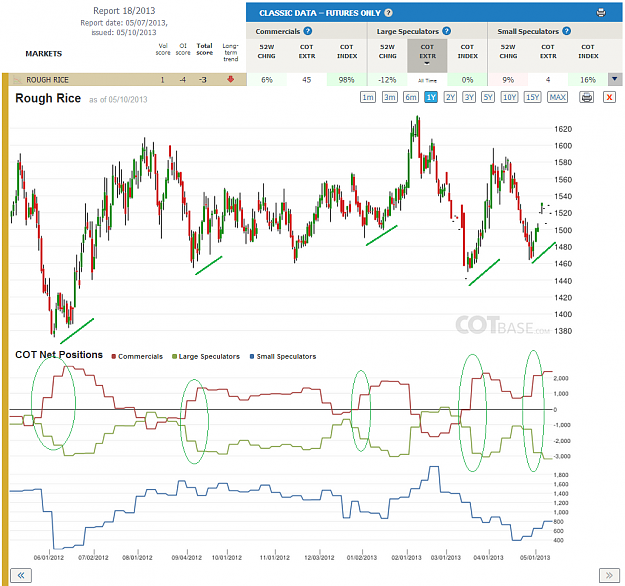
Rough Rice
COT Change (52W) / C-30%, LS-47% /
COT Index (3 year lb.) / C-96%, LS-3%, SS-14% /
Not only do we have a large change in cot positions, but we are at extreme levels also. Both of these are bullish signals, which is very confirming in case you are considering to go long.
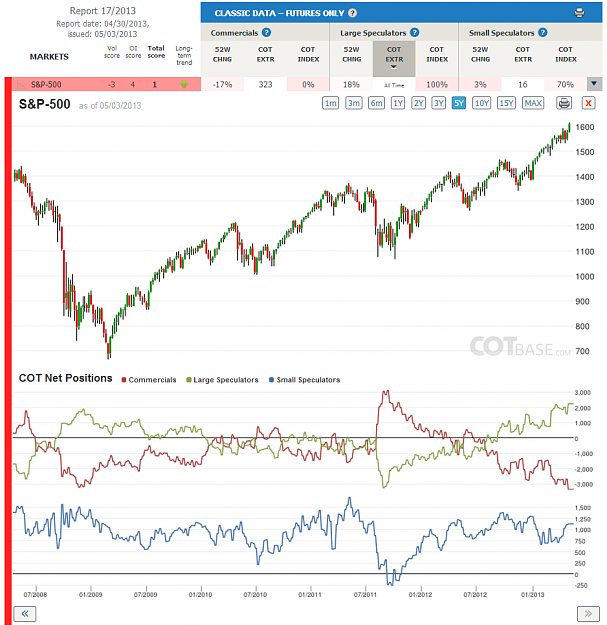
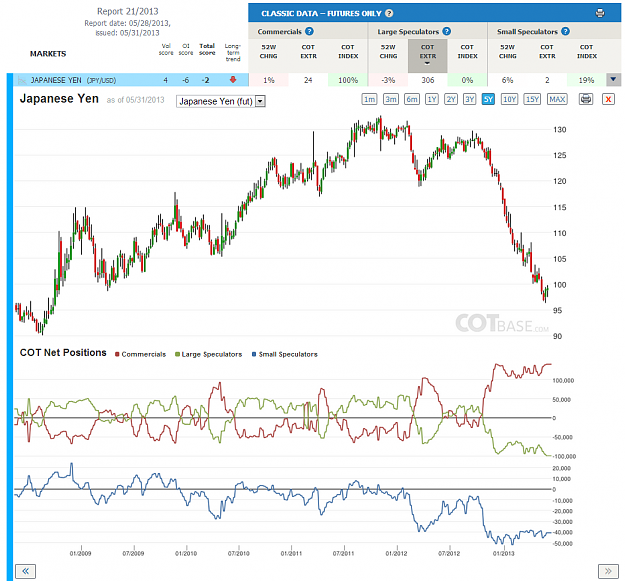
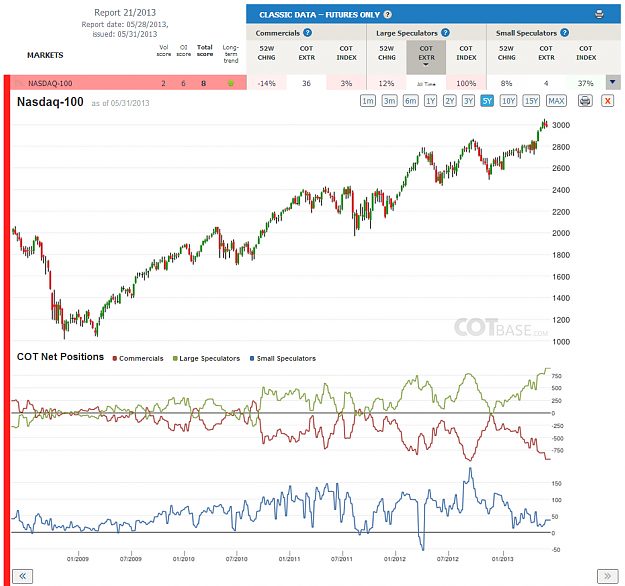
S&P-500
COT Extreme / C-323 report, LS-All Time COT extreme /
We have reached an all-time extreme level in S&P – at least in Large Speculators – so the big question can be asked: are we at/close to the top? It may easily be the case, but I would warn you that indexes strongly correlate --> have a look at the rest of them, whether the cot extreme exists there also, before you jump in the trade. The extreme in S&P can easily widen for many weeks or even a couple of months, before we see a top. Anyhow, even if we can’t pinpoint the exact top, we can start to position ourselves accordingly: you can scale out of your long positions or bring closer your stops or of carefully build up a short position.
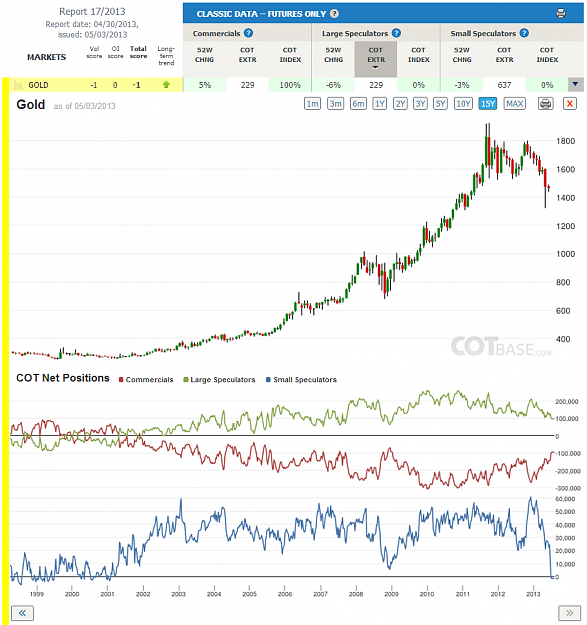
Gold
COT Extreme / C & LS-229 report, SS-637 report COT extreme /
Small Speculators… They’re the ones, who make the picture very interesting now --> The last time, they were net short, was back in 2001 / roughly 12 years ago!! The fact that they are soooo pessimistic, suggests to me, that we can expect prices to rise further.
I wish all of you good luck to this week’s trading,
All the best,
Dunstan
the original COT report --> here
COT charts --> here
The latest Commitments of Traders review is out (here).
Rough Rice
COT Change (52W) / C-30%, LS-47% /
COT Index (3 year lb.) / C-96%, LS-3%, SS-14% /
Not only do we have a large change in cot positions, but we are at extreme levels also. Both of these are bullish signals, which is very confirming in case you are considering to go long.
S&P-500
COT Extreme / C-323 report, LS-All Time COT extreme /
We have reached an all-time extreme level in S&P – at least in Large Speculators – so the big question can be asked: are we at/close to the top? It may easily be the case, but I would warn you that indexes strongly correlate --> have a look at the rest of them, whether the cot extreme exists there also, before you jump in the trade. The extreme in S&P can easily widen for many weeks or even a couple of months, before we see a top. Anyhow, even if we can’t pinpoint the exact top, we can start to position ourselves accordingly: you can scale out of your long positions or bring closer your stops or of carefully build up a short position.
Gold
COT Extreme / C & LS-229 report, SS-637 report COT extreme /
Small Speculators… They’re the ones, who make the picture very interesting now --> The last time, they were net short, was back in 2001 / roughly 12 years ago!! The fact that they are soooo pessimistic, suggests to me, that we can expect prices to rise further.
I wish all of you good luck to this week’s trading,
All the best,
Dunstan
the original COT report --> here
COT charts --> here
Attached Image(s) (click to enlarge)