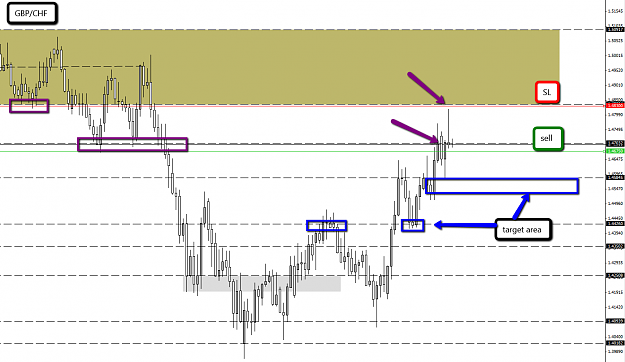
For gbdchf I see the shooting star on the daily. This is the indicator of a reversal. It also is crossing an area of s/r around 1.472 from the January time frame. The same s/r worked in June 2012. The s/r below current price is at 1.460 (a few days in late April) and 1.450(early Feb, late April, early May). If price reverses tomorrow to drop below yesterday's candle's low (1.4580) and the next lower s/r (1.460) then you enter at 1.4570. Your sl is set to 10 pips above yesterday's candle. 1.4731. You would be looking to take profit around 1.450.
Did I understand the method and setup correct?