Joined Sep 2011
|
Status: Minor crosses. Major pips.
|3,702 Posts
Same chart. Now connect a swing bottom with the next swing bottom for your Golden Ratio TP target. Nope, fibs don't work at all. They cannot be used as a trading tool.
well I did not really understand your fibs, but check out the default MT4 fibs..... surprisingly enough..they work quite perfectly
Ignored
See. Just think outside of the box. And what I meant about the Golden Ratio, put 1.618 and -1.618 in your fib tool and see what price does around there. And the inverse golden ratio 0.618 and -0.618.
When the dinosaur is above the rocket it's a sure sell signal. The dinosaurs become self-fulfilling prophecies when enough creationists believe in them. It also helps if you can find wally on the chart.
See. Just think outside of the box. And what I meant about the Golden Ratio, put 1.618 and -1.618 in your fib tool and see what price does around there. And the inverse golden ratio 0.618 and -0.618.
Ignored
well...still don't get your fibs..how do you use them?
When the dinosaur is above the rocket it's a sure sell signal. The dinosaurs become self-fulfilling prophecies when enough creationists believe in them. It also helps if you can find wally on the chart. {image}
Ignored
oh shit. that's... yes. just, yes.
Congratulations ScalaFX for coming out of the closet!
|
Joined Apr 2013
|
Status: I like to be where the actions at
|164 Posts
I don't use fibs much now but i used to use them for overbought and oversold areas, buying near 0 and selling at 100. I think the main reason people use fibs is because there is generally so much you can do with them. Every person i have spoke to have said different uses they find for them, some people use them for resistance, other people use them for no go areas, ie to spot ranges.
|
Joined Apr 2013
|
Status: the market knows every move u got
|14 Posts
I think that technical analysis is still a young discipline which is going to be around in the coming centuries. with regards to fib. analysis I think it is useful to some degree but I think it is overrated to a larger extent. I think that due to the limited but still growing amount of technical analysis tools, Fibonacci studies are experiencing a viral phase which is being fuelled by the rise of the emerging technologies like internet videos and computerized trading platforms which have preinstalled technical analysis tools. I once came across a video on youtube a long time ago which demonstrated how arbitrary or random support/resistance levels were chosen on random charts and it was quite intriguing how these levels seemed to hold in the projected future. I guess such phenomena will guarantee the semi-effectiveness of Fibonacci levels.
When the dinosaur is above the rocket it's a sure sell signal. The dinosaurs become self-fulfilling prophecies when enough creationists believe in them. It also helps if you can find wally on the chart. {image}
Ignored
But why the line on which the Dyanosor is standing is not straight with the axis?
I just spotted this thread and can't resist a post....whilst its a couple of years since they were all the rage in FF, I still use them as a measuring tool.....yesterday evening I suggested that the 50% retrace - OK, its how I use the MT4 Fib tool - would be a good area for a buy. Here's this morning's chart.
BTW, I also have the Fib Time Zones set to 18, 29, 47, 61, 76 periods......anyone know why?
I just spotted this thread and can't resist a post....whilst its a couple of years since they were all the rage in FF, I still use them as a measuring tool.....yesterday evening I suggested that the 50% retrace - OK, its how I use the MT4 Fib tool - would be a good area for a buy. Here's this morning's chart. BTW, I also have the Fib Time Zones set to 18, 29, 47, 61, 76 periods......anyone know why? {image}
I just spotted this thread and can't resist a post....whilst its a couple of years since they were all the rage in FF, I still use them as a measuring tool.....yesterday evening I suggested that the 50% retrace - OK, its how I use the MT4 Fib tool - would be a good area for a buy. Here's this morning's chart. BTW, I also have the Fib Time Zones set to 18, 29, 47, 61, 76 periods......anyone know why? {image}
Ignored
Can you specify at which price to buy as per the chart?
What is meant by Fib Time Zones set to 18, 29, 47, 61, 76 periods? Month or week or days?
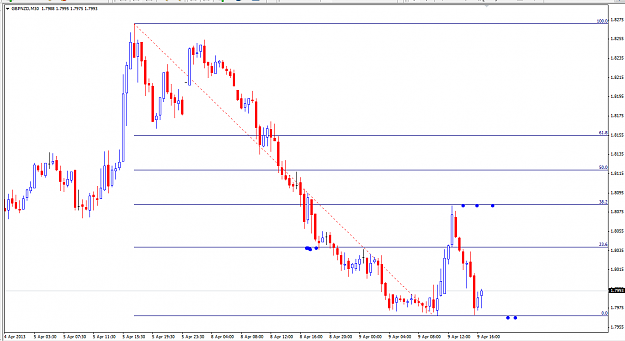
This is a sell setup of Fib. Can anybody explain me what should I look for and what is the selling price that I can understand from this chart. How this will be related to current market price since I need to fix my selling order at current market and this fib chart may be based on yesterday or earlier etc! Today's price range mat be different from that of the day fib chart was prepared! Then how actually fib. is signalling me the selling price here??
{image} This is a sell setup of Fib. Can anybody explain me what should I look for and what is the selling price that I can understand from this chart. How this will be related to current market price since I need to fix my selling order at current market and this fib chart may be based on yesterday or earlier etc! Today's price range mat be different from that of the day fib chart was prepared! Then how actually fib. is signalling me the selling price here??
Ignored
Generally when you defined your high and low point (0-100 fib levels), you wait for the price to retrace to a given level inside this range.
Your pic show the fib wrongly. I would have plotted the 0 at the low point instead of the high.