• Home
  • Forums
  • Trades
  • News
  • Calendar
  • Market
  • Brokers
  • Login
  • Join
  • User/Email: Password:
  • 12:50am
Menu
  • Forums
  • Trades
  • News
  • Calendar
  • Market
  • Brokers
  • Login
  • Join
  • 12:50am
Sister Sites
  • Metals Mine
  • Energy EXCH
  • Crypto Craft

Options

Bookmark Thread

First Page First Unread Last Page Last Post

Print Thread

Similar Threads

Magic Trade Journal 177 replies

Magic Trade Research Journal 110 replies

The volume formula. 8 replies

Metatrader Formula language help 3 replies

Formula for risking X percentage on a position... 5 replies

  • Trading Journals
  • /
  • Reply to Thread
  • Subscribe
  • 34
Attachments: FM's Magic Formula Journal
Exit Attachments

FM's Magic Formula Journal

  • Last Post
  •  
  • Page 1 2 3
  • Page 1 2 3
  •  
  • Post #1
  • Quote
  • First Post: Edited Feb 26, 2013 6:30am Feb 21, 2013 2:52pm | Edited Feb 26, 2013 6:30am
  •  Forex Magic
  • | Joined Feb 2013 | Status: Member | 315 Posts
.


Some years ago I developed a Trading System.

Here I hope to journal some Trade Set Ups and Results.

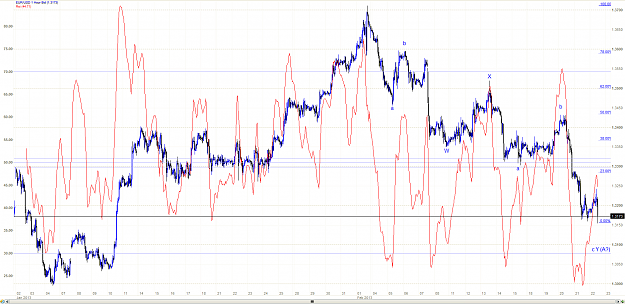
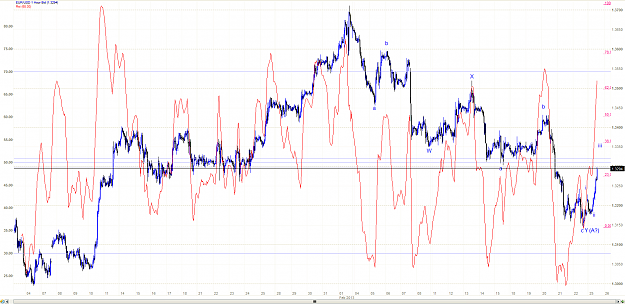
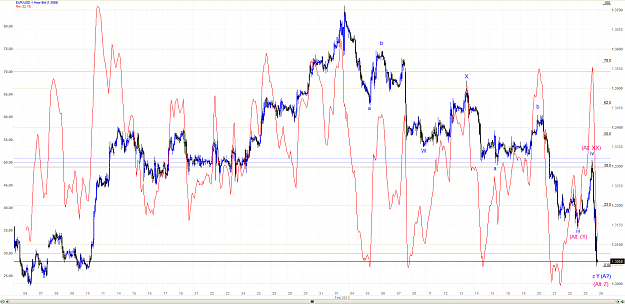
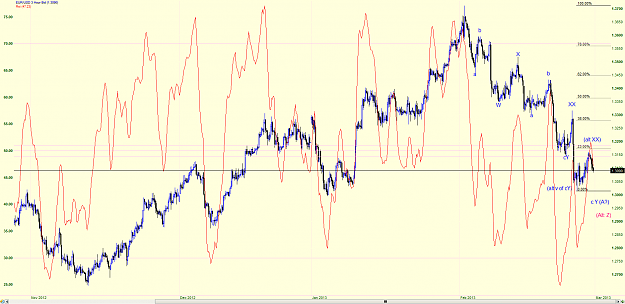
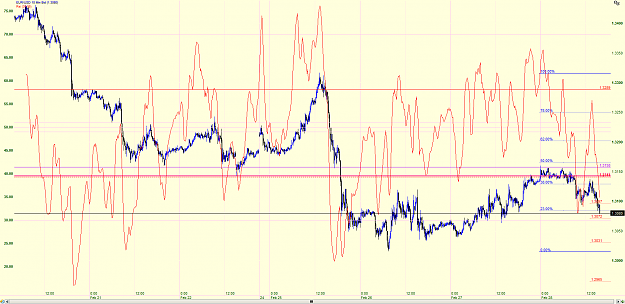
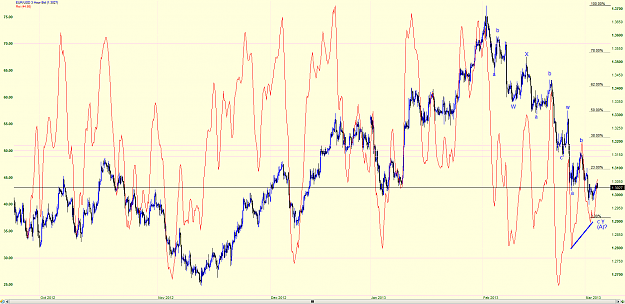
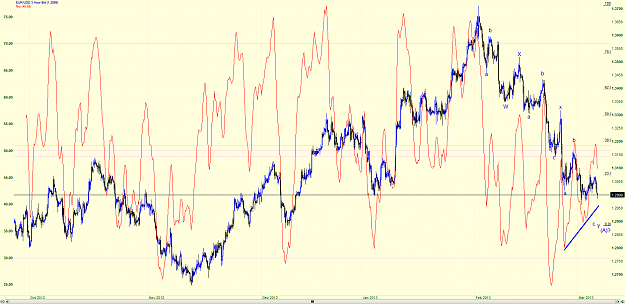
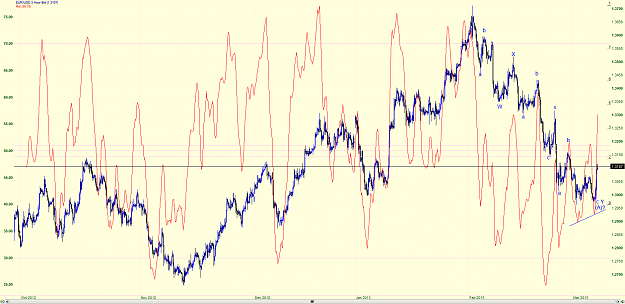
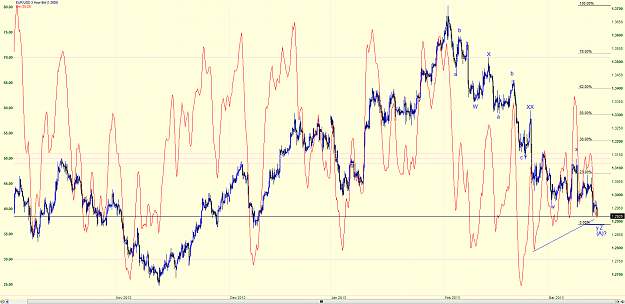
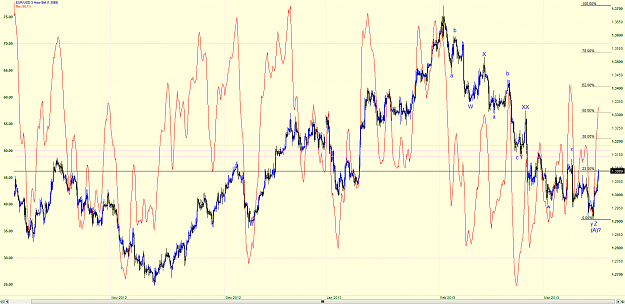
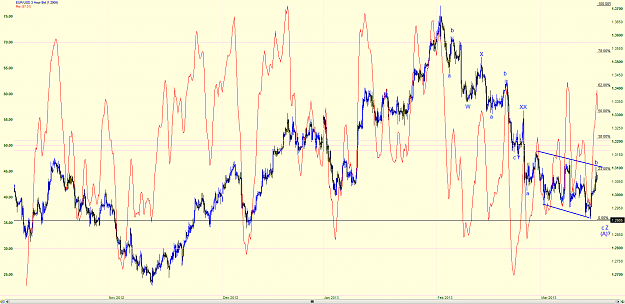
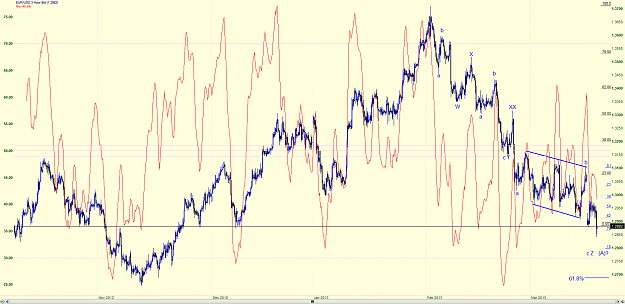
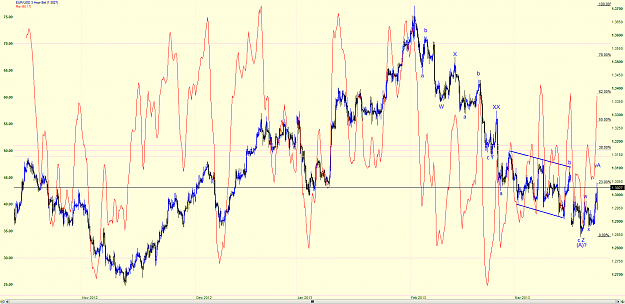
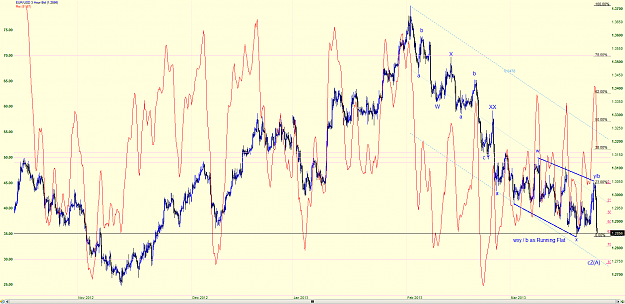
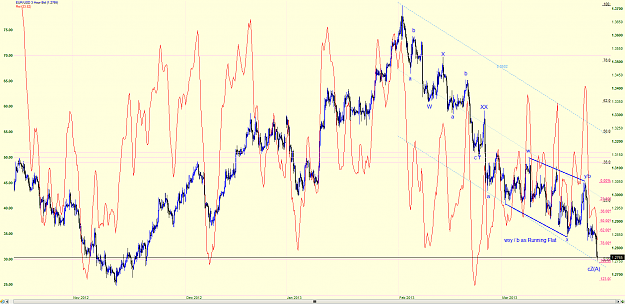
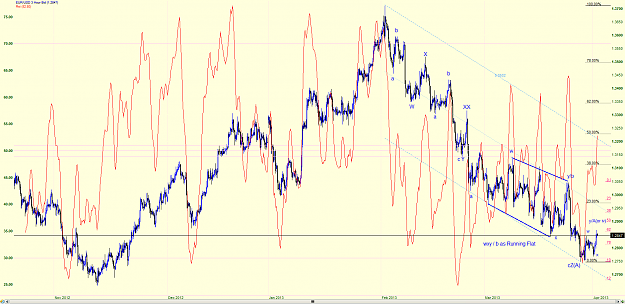
The System is simple enough, it utilises a "Sophisticated RSI" which I have developed over a long time to optimise immaculately the time at which to Buy or Sell a Pair.

Essentially when the Indicator points up it is bought and when it points down it is sold.

I use it over many time frames including 10m, 1Hr, 3Hr and Day.


Please feel free to Comment or Ask any Questions.


.
  • Post #2
  • Quote
  • Feb 22, 2013 6:17am Feb 22, 2013 6:17am
  •  Forex Magic
  • | Joined Feb 2013 | Status: Member | 315 Posts
Thus far, I have been a member for a few days and already I am subscribed to a number of Threads of Interest & Participation.

As usual, with Forum's, I find myself getting slightly distracted and scattered by all the posts and places and so perhaps focus on my own Journal is best and anyone that would wish to view or reply to it may do so.

There are a number of pairs that I'm watching (about 10) and I have set my Bespoke System up to monitor these.

In addition I am also using Elliott Wave Theory but that alone can be unreliable whereas my Personal Indicator Settings often provide greater clarity.

Here is an interesting one:

Eur/Usd 1 Hour..
Attached Image (click to enlarge)
Click to Enlarge

Name: eu1.png
Size: 81 KB
 
 
  • Post #3
  • Quote
  • Feb 22, 2013 6:23am Feb 22, 2013 6:23am
  •  Forex Magic
  • | Joined Feb 2013 | Status: Member | 315 Posts
Following the above..

The 3 Hour RSI is biting the dust and looks ripe for a Bullish move once the present downward structure is complete.

When the 1 Hour RSI bottoms out and turns up then I should have tremendous scope for a Eur/Usd Long Trade... perhaps Monday / Tuesday next week. I would expect some Divergence on the 1 Hour Charts RSI too.

This is no conventional RSI but one I have developed over several years.

Eur/Usd 3 Hour..
Attached Image (click to enlarge)
Click to Enlarge

Name: eu3.png
Size: 71 KB
 
 
  • Post #4
  • Quote
  • Edited at 4:36am Feb 25, 2013 4:12am | Edited at 4:36am
  •  Forex Magic
  • | Joined Feb 2013 | Status: Member | 315 Posts
Eur/Usd:

While my System is saying that we are in still in a Shorter Term BUY situation I maintain that perhaps Eur/Usd may have another dip prior to making a more significant rise.

I await either a higher low or lower low in price before deciding what to do with this pair but may intra-day trade it.

Eur/Usd 1 Hour:
Attached Image (click to enlarge)
Click to Enlarge

Name: eu1.png
Size: 82 KB
 
 
  • Post #5
  • Quote
  • Feb 25, 2013 4:33am Feb 25, 2013 4:33am
  •  Forex Magic
  • | Joined Feb 2013 | Status: Member | 315 Posts
Gbp/Jpy


For a few days I have had a "Buy Box" sitting on my GJ Charts.

Perhaps today shall see another dip down in price before some upwards movement can be expected.

Gbp/Jpy 3 Hour:
Attached Image (click to enlarge)
Click to Enlarge

Name: gj3.png
Size: 58 KB
 
 
  • Post #6
  • Quote
  • Feb 25, 2013 7:53am Feb 25, 2013 7:53am
  •  Forex Magic
  • | Joined Feb 2013 | Status: Member | 315 Posts
.

EUR/USD:


Presumably the W-X-Y Correction completed as shown.

Eur/Usd 1 Hour

.
Attached Image (click to enlarge)
Click to Enlarge

Name: eu1.png
Size: 82 KB
 
 
  • Post #7
  • Quote
  • Edited at 5:35pm Feb 25, 2013 5:09pm | Edited at 5:35pm
  •  Forex Magic
  • | Joined Feb 2013 | Status: Member | 315 Posts
Eur/Usd:


Trading is fun isn't it?!

I figured the move up looked a little impulsive to be a Correction but hey ho....

Assuming that this is a Corrective Sequence I assume the Count I had before but include a Triple Zig-Zag Alt. Count.

I certainly see some further downside and this is likely to confirm the situation more thoroughly, meanwhile the System's Indicator is doing a better job than the Count(s) can and continue to provide immaculate Signals.

Eur/Usd 1 Hr Chart:
Attached Image (click to enlarge)
Click to Enlarge

Name: eu1.png
Size: 84 KB
 
 
  • Post #8
  • Quote
  • Feb 28, 2013 10:32am Feb 28, 2013 10:32am
  •  Forex Magic
  • | Joined Feb 2013 | Status: Member | 315 Posts
Eur/Usd:


After a long, protracted and rather elaborate correction it appears that new low could be forth-coming.

Eur/Usd 3 Hr Chart:
Attached Image (click to enlarge)
Click to Enlarge

Name: 3eu.png
Size: 60 KB
 
 
  • Post #9
  • Quote
  • Feb 28, 2013 10:37am Feb 28, 2013 10:37am
  •  Forex Magic
  • | Joined Feb 2013 | Status: Member | 315 Posts
Eur/Usd:

The following Chart shows my Short Entry, the SL is now set 1 pip in profit.

Eur/Usd 10 Min Chart:
Attached Image (click to enlarge)
Click to Enlarge

Name: eu10.png
Size: 56 KB
 
 
  • Post #10
  • Quote
  • Mar 5, 2013 1:52am Mar 5, 2013 1:52am
  •  Forex Magic
  • | Joined Feb 2013 | Status: Member | 315 Posts
Eur/Usd:


Perhaps??!!

Eur/Usd 3 Hr Chart:
Attached Image (click to enlarge)
Click to Enlarge

Name: eu3tues.png
Size: 60 KB
 
 
  • Post #11
  • Quote
  • Edited at 10:46am Mar 6, 2013 10:34am | Edited at 10:46am
  •  Forex Magic
  • | Joined Feb 2013 | Status: Member | 315 Posts
Eur/Usd:


I suppose that the present move down shall terminate somewhere close to 1.2885

Eur/Usd 3 Hr Chart:
Attached Image (click to enlarge)
Click to Enlarge

Name: wedseu3.png
Size: 58 KB
 
 
  • Post #12
  • Quote
  • Mar 7, 2013 2:41pm Mar 7, 2013 2:41pm
  •  Forex Magic
  • | Joined Feb 2013 | Status: Member | 315 Posts
Eur/Usd:


It is possible that c of Y of (A) completed as an Ending Diagonal.

With the Bank Stress Test Results later today and NFP tomorrow, one has to maintain an open mind.

Eur/Usd 3 Hr Chart:
Attached Image (click to enlarge)
Click to Enlarge

Name: eu3.png
Size: 57 KB
 
 
  • Post #13
  • Quote
  • Mar 14, 2013 7:14am Mar 14, 2013 7:14am
  •  Forex Magic
  • | Joined Feb 2013 | Status: Member | 315 Posts
Eur/Usd:


Reverting back to my view on Wednesday March 6..


I suppose that the present move down shall terminate somewhere close to 1.2885

Eur/Usd 3 Hr Chart:
Attached Image (click to enlarge)
Click to Enlarge

Name: euthurs3.png
Size: 59 KB
 
 
  • Post #14
  • Quote
  • Mar 15, 2013 8:43am Mar 15, 2013 8:43am
  •  Forex Magic
  • | Joined Feb 2013 | Status: Member | 315 Posts
Eur/Usd:


It appears that the Count on the Corrective Sequence was probably correct, and as determined by the apparent Impulsive Move from the predicted end.

Price is currently challenging the 23% Fibo Level and the current velocity suggests that it shall surpass that.

The RSI in both Day and 3Hr formats certainly testifies to that possibility too.


Eur/Usd 3 Hr Chart:
Attached Image (click to enlarge)
Click to Enlarge

Name: eu3.png
Size: 58 KB
 
 
  • Post #15
  • Quote
  • Mar 17, 2013 5:06pm Mar 17, 2013 5:06pm
  •  Forex Magic
  • | Joined Feb 2013 | Status: Member | 315 Posts
Eur/Usd:


The Effect of the Changes within Cyprus have caused the market to react during Close.

My Charts do not as yet show the Gap down but I prepare in advance by amending the Count to reflect this as shown below.

1.2881 shall continue to be an Interim Target in any event as this is the 50% Fibo Level.


Eur/Usd 3 Hr Chart:
Attached Image (click to enlarge)
Click to Enlarge

Name: eu3.png
Size: 58 KB
 
 
  • Post #16
  • Quote
  • Mar 19, 2013 2:38pm Mar 19, 2013 2:38pm
  •  Forex Magic
  • | Joined Feb 2013 | Status: Member | 315 Posts
Eur/Usd:


The Interim Target was reached perfectly.

While it is difficult to conclude at this stage where the current down-trend shall complete it is reasonable to consider the following:

c = a @ approx. 1.2800

61.8% @ approx 1.2700

Wave structure suggests a close watch on these levels too and we could see a move up from either.


Eur/Usd 3 Hr Chart:
Attached Image (click to enlarge)
Click to Enlarge

Name: uu3.png
Size: 60 KB
 
 
  • Post #17
  • Quote
  • Mar 24, 2013 7:58pm Mar 24, 2013 7:58pm
  •  Forex Magic
  • | Joined Feb 2013 | Status: Member | 315 Posts
Eur/Usd:


I presume the Pair in now in correction against the prior move down and presently forming Wave y of A.


Eur/Usd 3 Hr Chart:
Attached Image (click to enlarge)
Click to Enlarge

Name: eu3.png
Size: 59 KB
 
 
  • Post #18
  • Quote
  • Mar 25, 2013 12:46pm Mar 25, 2013 12:46pm
  •  Forex Magic
  • | Joined Feb 2013 | Status: Member | 315 Posts
Eur/Usd:


The Pair moved down as expected and indicated in advance by the down-turning of my finely tuned Indicator. While the previous count expected a 3 wave move down to form wave b it is apparent that it has become instead an Impulse.

I have amended the count to reflect this and use instead my Alt. Count which sees a Running Flat as the alternative to the Diagonal Triangle shown prior.

There is a Fibo table (in Red) which shows the initial Targets for the end of cZ(A) where 100% is a = c.


Eur/Usd 3 Hr Chart:
Attached Image (click to enlarge)
Click to Enlarge

Name: eu33.png
Size: 66 KB
 
 
  • Post #19
  • Quote
  • Mar 27, 2013 10:13am Mar 27, 2013 10:13am
  •  Forex Magic
  • | Joined Feb 2013 | Status: Member | 315 Posts
Eur/Usd:


The Pair moved down as expected and indicated in advance by the down-turning of my finely tuned Indicator.

There is a Fibo table (in Red) which shows the initial Targets for the end of cZ(A) where 100% is a = c.

Price is currently just short of a=c.


Eur/Usd 3 Hr Chart:
Attached Image (click to enlarge)
Click to Enlarge

Name: 3eu.png
Size: 68 KB
 
 
  • Post #20
  • Quote
  • Apr 1, 2013 3:09pm Apr 1, 2013 3:09pm
  •  Forex Magic
  • | Joined Feb 2013 | Status: Member | 315 Posts
Eur/Usd:


I'm inclined to consider that the move down may be complete.

Wave c is 100% of Wave a.

However, price did not reach the 61.8% level per the day chart, and with that I choose an open-minded approach and label the subsequent move to allow for a further wave down to complete the structure.

In either event, I see a 3 wave move up from the bottom to form w, a further 3 wave down to form x, and I believe that we are presently experiencing wave y.

This shall complete either, wave A of the move up, or, wave iv of 5 of c down.

The structure is likely to become much more predictable soon I think.


Eur/Usd 3 Hr Chart:
Attached Image (click to enlarge)
Click to Enlarge

Name: eu3.png
Size: 71 KB
 
 
  • Trading Journals
  • /
  • FM's Magic Formula Journal
  • Reply to Thread
    • Page 1 2 3
    • Page 1 2 3
0 traders viewing now
  • More
Top of Page
  • Facebook
  • Twitter
About FF
  • Mission
  • Products
  • User Guide
  • Media Kit
  • Blog
  • Contact
FF Products
  • Forums
  • Trades
  • Calendar
  • News
  • Market
  • Brokers
  • Trade Explorer
FF Website
  • Homepage
  • Search
  • Members
  • Report a Bug
Follow FF
  • Facebook
  • Twitter

FF Sister Sites:

  • Metals Mine
  • Energy EXCH
  • Crypto Craft

Forex Factory® is a brand of Fair Economy, Inc.

Terms of Service / ©2022