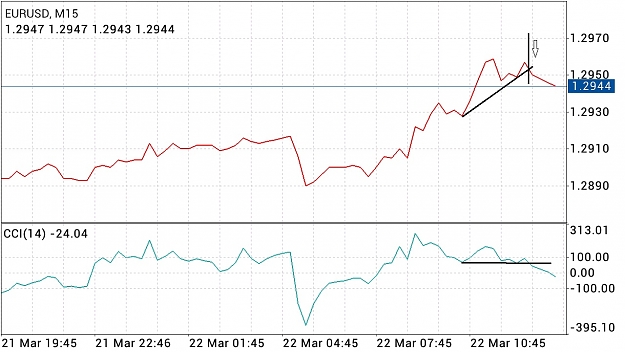
I am intrested in this "Cyprus effect" - I wanted to get some triggers where the price will move, so I decided to check a lower time frame. I went down to M15, which I am not usualy doing.
And I found a signal for Short. I have missed it already passed. And I would not take that small time frame, but it might be good later on to see if it worths staying in a trade or better to close it.
Attached Image (click to enlarge)
I'll try to post some lower time frame charts next week as well. Maybe we will get out of something from these. Like confirmation of a higher TF signal. Or an earlier entry for a Higher TF signal.
If anyone of you readers are following up or making demo trades based on this technique, plase share your charts.
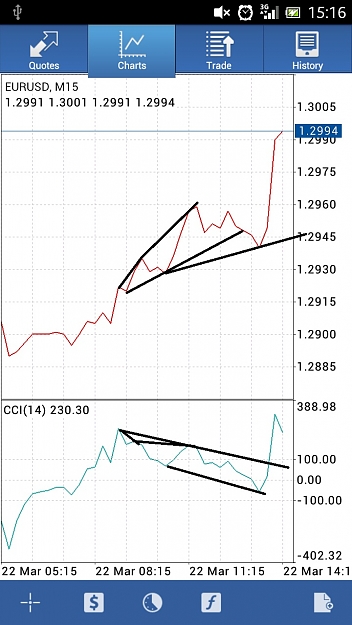
So I've taken a look on the M15 and made more checks. Its very intresting. It gives a lot of signals, but things are changing so fast.
Now there was a long signal that got broken strongly. However this is very hard to trade and to decide where to turn to. I am not recommending lower time frames!
I think there is some support for us in or decision.
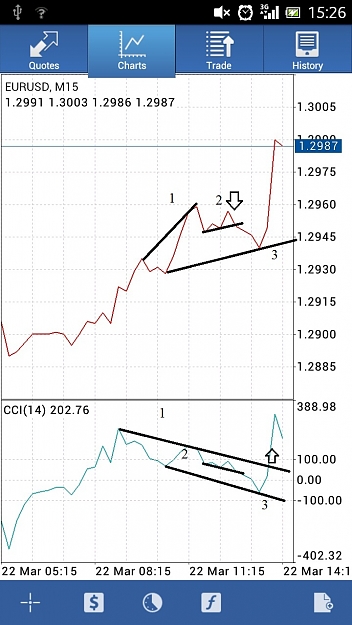
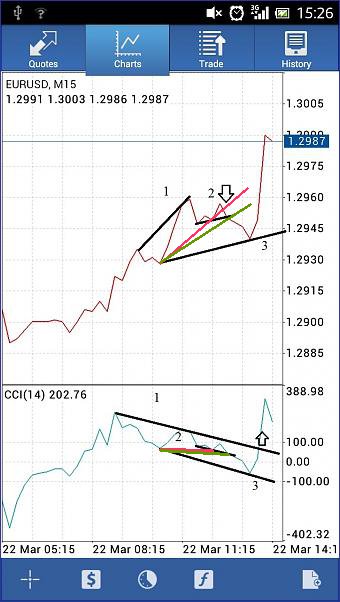
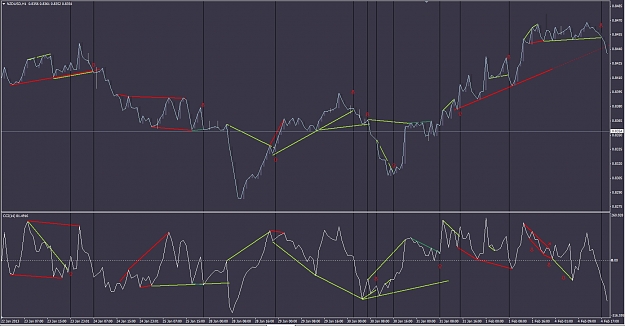
So according to the picture. The 1st signal was a bearish Divergence. It has started and then turned back Then we got the 2nd signal which is "our signal" for short. According to that. and for the 1st signal for the bearish movement, we could have entered short at that point.
When we got or 3rd signal, which is a bullish signal. We already had on our CCi the 1st signals trend line, which indicates our trigger for long, of course wen the CCi goes above it. So here its a guidiance for to go long at the arrow.
So in a few words, we should not trade the regular and hidden divergences, but use them to confirm our signals that were drawn up many candles before.
I'll try to get more examples for this once I get home. It could be a good way for us to be 200% sure of our trades.
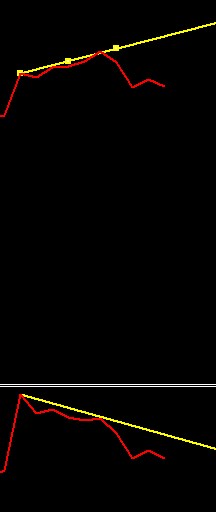
I am attaching a chart of the NZDUSD pair. I scrolled back a little just to see how things were in the past. I tried to mark it with colours what I think to be a good signal.
Attached Image (click to enlarge)
I hope it helps understanding the way I see these. I am trying to make some more stuff for you guys to help understanding these signals.
Subscribed to this thread.
Thanks toolz for this approach.
Cci trendline break based on divergence. Is it your own finding ?
Edit have you tried with classic OHLC candles to find divergences, instead of using close price only ?
That would void some divergences you spot, cuz in my opinion you spot too much of them (last screenshot) ?
What's the reason behind the use of line chart - close price ?
This is an very interesting strategy that Tools was started, thanks for that,
I will show some charts how to trade this with a line chart and barchart and how to look at this strategy, it took me a few hours to study and analyze but now I think I got it
I will post 3 times behind eachother
First I will show you a chart in the gbp/chf 4 hr, with negative divergence on the CCI 14,
Subscribed to this thread.
Thanks toolz for this approach.
Cci trendline break based on divergence. Is it your own finding ?
Edit have you tried with classic OHLC candles to find divergences, instead of using close price only ?
That would void some divergences you spot, cuz in my opinion you spot too much of them (last screenshot) ?
What's the reason behind the use of line chart - close price ?
Thanks,
Ignored
Hi!
Thanks for subscribing!
Yes, this was my own Idea. I was working a lot with the CCi and wanted to develope it as I was not satisfied with the original way of the divergences. And I was drawing alot and alot. Then got to a point where something was started and I wanted to understand what is the cause of so many good signals with the CCi. And I realized that I was watching the Divergences in the same way as others, but if you open your eyes, you will realize what is behind of it.
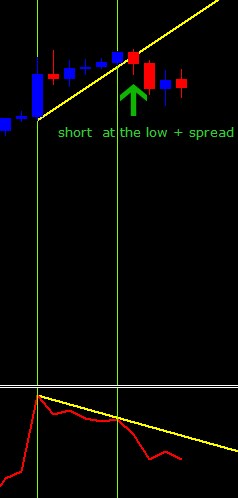
we have negative divergence on RSi so we expect a short position.
Now draw trendline from the lows and see that the candle break the trendline..
open a short position at the low + spread.
try this and you will win 8out of 10 times
regards Dutchsignals
Ignored
Let me help with this approach.
I have something that you wil llike.
See attached
Its basically a CCI with candle sticks. With integrated Divergence watching.
Actualy it works fine and I've used it alot. But the reason of why I've ended up with the closed CCi and line chart is that, pshychologically it helps me a lot. Less information helps to make better decisions.
If this helps you guys to trade, I am glad to share it.
*EDIT: Before I forget, this version is updating normally, the original was redrawing and was not updating by ticks. And you can change the thiness of the bars.