• Home
  • Forums
  • Trades
  • News
  • Calendar
  • Market
  • Brokers
  • Login
  • Join
  • User/Email: Password:
  • 2:29pm
Menu
  • Forums
  • Trades
  • News
  • Calendar
  • Market
  • Brokers
  • Login
  • Join
  • 2:29pm
Sister Sites
  • Metals Mine
  • Energy EXCH
  • Crypto Craft

Options

Bookmark Thread

First Page First Unread Last Page Last Post

Print Thread

Similar Threads

Price Will Tell - Supply/Demand Price Action Trading 1,854 replies

Trading with Price Action - Daily Trading Analysis 82 replies

The Price is Right: Trading Price Action 218 replies

2 day price action 8 replies

  • Commercial Content
  • /
  • Reply to Thread
  • Subscribe
  • 2,983
Attachments: Price Action in Day Trading by Dadas
Exit Attachments
Tags: Price Action in Day Trading by Dadas
Cancel

Price Action in Day Trading by Dadas

  • Last Post
  •  
  • 1 56Page 789 235
  • 1 Page 7 235
  •  
  • Post #121
  • Quote
  • Mar 21, 2013 7:11pm Mar 21, 2013 7:11pm
  •  realjumper
  • Joined Feb 2009 | Status: Hasta la victoria siempre - El Che | 19,542 Posts
Quoting Dadas
Disliked
I must straighten you out on the indicator issue.
You are absolutely wrong!

I have worked with almost every indicator there is.
I have written my own EAs based on indicators,
tested them, analized every single trade, Profit and Loss,
I really do know how indicators work! From the inside!
Ignored
Of course indicators are tools.....just as drawing trendlines are tools.....just as candles are tools.

You seem to be missing the point....the candles themselves are lagging indicators. There can never be 'leading' indicators, that is clearly impossible. Some people fall into the trap of thinking that candles are the be all and end all of trading and they are mistaken......as I have said, candles are lagging indicators just as everything else we retail traders have access to...they can only show the price action as it was in the past (extremely recent past of course).

Yes, moving averages lag too, but not due to any delay or listing further down the pecking order in receiving the data, they lag because the are taking the AVERAGE of the past action and displaying it. The longer the period of the MA, the more the lag, but not due to any inherent delay in processing the data, the delay is due to the period selected. A 200 MA will seem to lag more than a 2 ma .......nothing to do with anything other than the period chosen by the user......the calculation for either MA is chicken feed for even a low end computer to take care of.

Moving averages, stochastic, rsi etc have been around a very long time and were developed by people far more clever than you and I, and are still in widespread use in the banks, brokers and hedge funds etc etc all over the world. Japanese candle's are also used in this way, from their humble beginnings (more or less) in the rice houses of Japan.

The point to my original post was not to get into the finer points of how indicators work but to explain to you that indicator trading can be a very profitable way to trade and also is a valid way to trade. Not everyone loses who trades with indicators as you erroneously stated, anymore than everyone who trades with candles and price action.

There is no right or wrong way to trade.....there is only profit or no profit. Please do not assume to make such silly statements as:

* People tend to look for something which, like traffic lights, will tell them
when to Go and when to Stop. They rely on indicators, and lose their money.

* After some time you will see for yourself how useless the indicator had been.

These statements are wrong and they are arrogant. *YOU* clearly think that you understand price action and that's the way you wish to trade....and that's fine. I understand the indicators that I use AND the price action and that is the way I trade. As I said, I can trade with no candles at all on the chart.....I can trade just with the indicators and still turn a profit at the end of the week.

All indicators lag......there are no leading indicators, and into this category fit's candles as well. Whether you like it or not, it is a fact.
Doing what you like is Freedom. Liking what you do is Happiness.
 
 
  • Post #122
  • Quote
  • Mar 21, 2013 7:23pm Mar 21, 2013 7:23pm
  •  Dadas
  • | Commercial Member | Joined Sep 2012 | 3,282 Posts
Quoting Gumrai
Disliked
"Free your mind beyond definition, see things as they are."

You say this and yet you immediately follow up with your own definition of what an engulfing candle is

"For me, any Candle that covers the previous one completely,
meaning the body covers the body and the body extends beyond
the body of the previous Candle, and it is in the opposite direction, is an Engulfing Candle."

Even by your definition, the weekly candle on GBPUSD weekly chart is not an engulfing candle.
If every...
Ignored
Ever heard of courts, law suits, interpretation of law?

There are no models in real life.

Laws are only general structures, general definitions.

The Court interprets each case individually.

If life was like you would like it to be, by definition,
there would be no problem to profit in Forex.

Everybody would use one Universal EA and it would work according to definition.

Life and Forex do not go by definition.

True, it is important for communication.

Thus, should I write my own protocol, first?

Maybe, that is the answer.

Maybe I should call the whole method like:

FX New Visual Art Trading Concept

Now, that is an idea!
Trade the facts, not opinions.
 
 
  • Post #123
  • Quote
  • Mar 21, 2013 7:28pm Mar 21, 2013 7:28pm
  •  Dadas
  • | Commercial Member | Joined Sep 2012 | 3,282 Posts
Quoting realjumper
Disliked
Of course indicators are tools......
Ignored
Of course, we are trading historical quotations, not the real bank quotations.

I once had the same idea, I had so many indicators on my chart,
that the chart was practically impossible to read, thus useless.

OK, enough, we will only be repeating ourselves from this point on.

Thank You.
Trade the facts, not opinions.
 
 
  • Post #124
  • Quote
  • Mar 21, 2013 7:30pm Mar 21, 2013 7:30pm
  •  realjumper
  • Joined Feb 2009 | Status: Hasta la victoria siempre - El Che | 19,542 Posts
Quoting Dadas
Disliked
Of course, we are trading historical quotations, not the real bank quotations.

I once had the same idea, I had so many indicators on my chart,
that the chart was practically impossible to read,
thus useless.

OK, enough, we will only be repeating ourselves from this point on.

Thank You.
Ignored
Because you didn't understand how to use the indicators
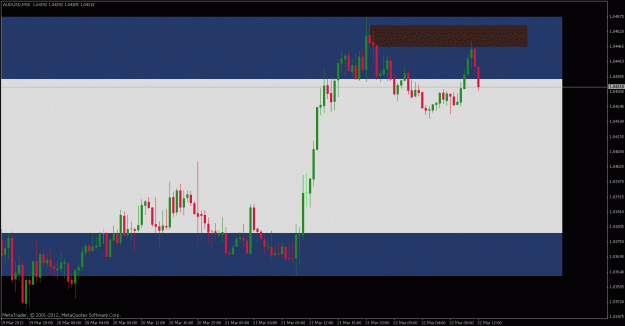
Doing what you like is Freedom. Liking what you do is Happiness.
 
 
  • Post #125
  • Quote
  • Mar 21, 2013 8:48pm Mar 21, 2013 8:48pm
  •  Gumrai
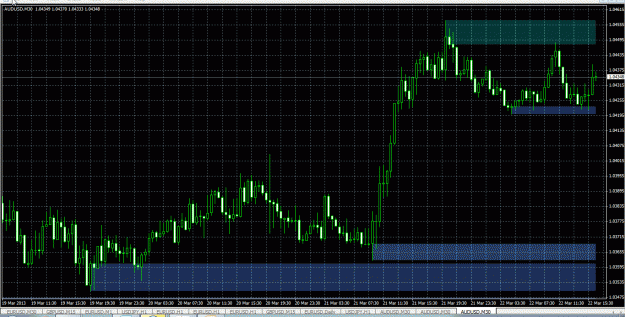
  • Joined Oct 2012 | Status: Member | 1,959 Posts
Quoting Dadas
Disliked
Ever heard of courts, law suits, interpretation of law?

There are no models in real life.

Laws are only general structures, general definitions.

The Court interprets each case individually.

If life was like you would like it to be, by definition,
there would be no problem to profit in Forex.

Everybody would use one Universal EA and it would work according to definition.

Life and Forex do not go by definition.

True, it is important for communication.

Thus, should I write my own protocol, first?

Maybe, that is the answer.

Maybe...
Ignored
Yes, I have heard of courts of law, I've also heard of precedent.
If I were to post a chart consisting of red and green candles and then referred to the blue candle, you may probably think "What is the idiot talking about?!" And rightly so.
When you talk about an engulfing candle, that is what I will look for. If you are referring to an engulfing candle that doesn't exist, then I will be referencing a different part of the chart than you intended. That means that you are unable to communicate clearly.

I think that it would be an excellent idea to change the title of this thread.
I came here because I may be able to add to or improve my skill at trading with PA.
Unfortunately, the title is misleading as there is nothing here about PA, just some long-winded mystical concept.

Good luck with your thread Dadas. I will be unsubscribing now.
Please Do Not PM Me With Coding Enquiries
 
1
  • Post #126
  • Quote
  • Mar 22, 2013 12:02am Mar 22, 2013 12:02am
  •  realjumper
  • Joined Feb 2009 | Status: Hasta la victoria siempre - El Che | 19,542 Posts
I don't agree with much that Gumrai says, but in this case he is correct. In order for an Engulfing Candle to be given that name, it necessarily *MUST* engulf the previous candle in it's entirety. If it does not engulf the previous candle, then it does not engulf anything and can not be referred to as an Engulfing Candle.

You can't change the definition of the Engulfing Candle because it pleases you to do so......in order to be given the name "Engulfing"......it must Engulf! There is no gray area here.

Your patterns may well be valid, but those candles you show are not Engulfing Candles......they "engulf" nothing.

Here is the correct definition of Engulfing Candles
Doing what you like is Freedom. Liking what you do is Happiness.
 
 
  • Post #127
  • Quote
  • Mar 22, 2013 1:08am Mar 22, 2013 1:08am
  •  dim4ik42
  • Joined Apr 2008 | Status: Member | 1,270 Posts
Hello, Dadas!

I am reading your thread with interest! Great material here. I really enjoy to follow what you have written!

Keep it going!!!

Thank you!


P.S. You see Mr. Market as it is. Buyers and sellers.
 
 
  • Post #128
  • Quote
  • Mar 22, 2013 2:58am Mar 22, 2013 2:58am
  •  lilies
  • | Joined Feb 2012 | Status: Member | 13 Posts
hi dadas

I think you're doing a great job sharing with strangers what you've spent much time developing. For the sake of clarity, perhaps you can refer to those candles which do not cover the entire previous candle as a bullish candle. I must admit I had a problem following your thinking when looking at the posted charts as I couldn't find the engulfing candles either.

May I request that you insert I, 2, 3 etc when you're referring to specific candles so that its easier to follow.

Do you keep a look-out for news coming out or its strictly price action candle?

thanks for your generous sharing!
 
 
  • Post #129
  • Quote
  • Mar 22, 2013 3:21am Mar 22, 2013 3:21am
  •  jgadefelth
  • | Joined Jan 2008 | Status: Trillion Dollar Man | 1,494 Posts
I hope it gets more easy to understand, because i dont get anything this far.


Best regards
 
 
  • Post #130
  • Quote
  • Mar 22, 2013 6:28am Mar 22, 2013 6:28am
  •  d4n
  • | Joined Jul 2009 | Status: Member | 204 Posts
nice to see new thinking... keep up the good work Dadas!
Attached Image (click to enlarge)
Click to Enlarge

Name: au.gif
Size: 20 KB
 
 
  • Post #131
  • Quote
  • Mar 22, 2013 7:25am Mar 22, 2013 7:25am
  •  genie
  • | Joined Dec 2012 | Status: IN A BOTTLE | 177 Posts
Quoting realjumper
Disliked
There is no right or wrong way to trade.....there is only profit or no profit. Please do not assume to make such silly statements as:

* People tend to look for something which, like traffic lights, will tell them
when to Go and when to Stop. They rely on indicators, and lose their money.

* After some time you will see for yourself how useless the indicator had been.

These statements are wrong and they are arrogant. *YOU* clearly think that you understand price action and that's the way you wish to trade....and that's fine. I...
Ignored
Great post. I started my trading career with ONLY price action and I gradually transformed it into a trading style which suits me. And now my trading involves indicators. A lot of people here say indicators are bad, your charts should be clean, etc. But the problem is most likely they don't know how to properly utilise the indicators to their benefit. It's about having an open mind and realizing that everyone is different as well as there is no 'one size fit all' trading style.
 
 
  • Post #132
  • Quote
  • Mar 22, 2013 10:22am Mar 22, 2013 10:22am
  •  Afarensis
  • | Joined May 2012 | Status: Member | 489 Posts
Quoting Dadas
Disliked
Thank you for sharing.

Please, I will not hack other peoples programmes.
I need the open source mq4, not the ex4 file.
Only then I can either judge it myself, or ask my programmer friend to give me his opinion.

If this indicator draws what you show, I do not want it, it is useless to my method.

If you can provide the mq4 file, I will take a look at it.

Otherwise, thank you, but no, thank you.
Ignored
OK, here is the link http://www.forexfactory.com/showthre...56696&page=339
post 5076 of julexo
 
 
  • Post #133
  • Quote
  • Mar 22, 2013 10:42am Mar 22, 2013 10:42am
  •  Afarensis
  • | Joined May 2012 | Status: Member | 489 Posts
Quoting d4n
Disliked
nice to see new thinking... keep up the good work Dadas!
Ignored
How do you determine the black zone? mine is diferent
Attached Image (click to enlarge)
Click to Enlarge

Name: ScreenHunter_04 Mar. 22 09.41.gif
Size: 46 KB
 
 
  • Post #134
  • Quote
  • Mar 22, 2013 12:38pm Mar 22, 2013 12:38pm
  •  Dadas
  • | Commercial Member | Joined Sep 2012 | 3,282 Posts
Quoting lilies
Disliked
hi dadas

I think you're doing a great job sharing with strangers what you've spent much time developing. For the sake of clarity, perhaps you can refer to those candles which do not cover the entire previous candle as a bullish candle. I must admit I had a problem following your thinking when looking at the posted charts as I couldn't find the engulfing candles either.

May I request that you insert I, 2, 3 etc when you're referring to specific candles so that its easier to follow.

Do you keep a look-out for news coming out or its strictly...
Ignored
I like to be informed of the times potentially important news is scheduled.
So, I found a nice stand-alone programme, here on forexfactory called FX News Alert.
A handy application which can also run in the background and alarm us before the news.
Trade the facts, not opinions.
 
 
  • Post #135
  • Quote
  • Edited 6:20pm Mar 22, 2013 2:19pm | Edited 6:20pm
  •  Dadas
  • | Commercial Member | Joined Sep 2012 | 3,282 Posts
Quoting Afarensis
Disliked
How do you determine the black zone? mine is diferent
Ignored
I was hoping I had explained my idea of Price Consolidation or Congestion quite clearly
in the article: Understanding the chart
http://www.forexfactory.com/showthre...82#post6525082

Data is sent from the broker's server in data packets called ticks.
And translated to the chart picture in different Timeframes.

Price Consolidation can happen at any Timeframe level,
from a single tick to the monthly MN chart, or even Yearly, etc.

Gumrai's questions as labels on a chart were perfectly solid.
Why is the wick not a signal of Breakout or Breakdown?
It is not, because the price retraced in this certain Timeframe.
The Candle Closed below the resistance Zone,
thus confirming the validity of that Zone for this Timeframe.

On a smaller Timeframe it might heve been a signal for a local Bullish trend, a very short one.
But, still the larger Timeframe Resistance Zone stands solid, valid.

If we were able to trade with 0 spread and Take Profit of whatever is just above 0,
and we were able to trigger tens or hundreds of trades per second, we could trade
a 1 second chart - but, we can not!

So, we trade the M5 chart, as an example.
http://charts.mql5.com/1/195/gbpusd-m5-fxsalt-ltd-4.png

I have realized that apart from the defined Consolidation or Congestion Signals, such as Doji,
a series of Candles of about the same hight, etc., there are other Consolidation Zones, perhaps
visible on a lower Timeframe or, perhaps not clearly visible, because there is no chart with such a Tf.

I have defined two such important Consolidation Zones:
1. The Trend Begining Consolidation Zone (TBCZ),
2. The Potential Trend Ending Consolidation Zone (PTECZ).

1. The Trend Begining Consolidation Zone (TBCZ):
It is the Candle of opposite direction, preceeding the BreakOut Candle .
It signifies, shows a Consolidation Zone from some lower Tf.
It is not labelled "Potential", because it is a fact, when the BreakOut Candle Closes.

2. The Potential Trend Ending Consolidation Zone (PTECZ):
It is the Candle of opposite direction, just after the Trend Candle.
It signifies, shows a Consolidation Zone from some lower Tf.
It is labelled "Potential", because it can prove to be a signal of trend reversal.
Or, it can just prove to be a local Price Consolidation in the Trend Continuation.

My idea is based on the PTECZ.
As a Potential Trend Ending Consolidation Zone it is the important one.
Price always trends from a Local Consolidation Zone to another Consolidation Zone.

We always work with Closed Candles, thus indetification of the PTECZ becomes easy.
Esspecially those PTECZ which show on strong trends.

When we have identified a PTECZ, we can draw a rectangle to highlight it.
This gives us a visual refference, a Zone.

The important moment is to identify the price trend inside the PTECZ.
There could be smaller PTECZ inside the indentified PTECZ - it is up to
the trader which trend they want to exploit, the one inside the PTECZ, or the one outside the PTECZ?

So, the rest is just S/D - BreakOut or BreakDown - is the signal of the forming trend.
Retrace to the PTECZ from above, closing at a higher Low level is the confirmation of the Bullish Trend.
Retrace to the PTECZ from below, closing at a lower High level is the confirmation of the Bearish Trend.

Where the trader wants to Enter the Market is up to their strategy, alone.
Aggresive - Enter at earliest Trend formation signals inside the PTECZ with very tight SL.
Moderate Aggressive - Enter as soon as Price Breaks the PTECZ with tight SL.
Moderate - Enter as soon as the retrace closes confirming the Trend with moderate SL.
Conservative - Enter on strong confirmation of Trend.

In any case, the trader must see the potetial of the Market in the Term they are investing.
For the Daytrader it is the Daily Range and the position of the Price.
We must, also see the other PTECZ, historical, that may be important for the price, and highlight them.

That is where the Candle Zone comes in handy, because it can give us another refference
highlighting Potentially important Zones from a higher Timeframe.

This is how it works.

I hope, it is more clear now.

BTW. Thank You lilies - your post helped me realize the important issue -
you are right, I did make a mistake naming this Candle "Engulfing". Your post
is very constructive!

This is the difference between constructive and destructive:
Gumrai - destructive
lilies - constructive

IMPORTANT:
From this moment on the Engulfing in all previous posts stands for BreakOut or BreakDown, accordingly.
Trade the facts, not opinions.
 
 
  • Post #136
  • Quote
  • Mar 22, 2013 2:50pm Mar 22, 2013 2:50pm
  •  Dadas
  • | Commercial Member | Joined Sep 2012 | 3,282 Posts
Quoting genie
Disliked
Great post. I started my trading career with ONLY price action and I gradually transformed it into a trading style which suits me. And now my trading involves indicators. A lot of people here say indicators are bad, your charts should be clean, etc. But the problem is most likely they don't know how to properly utilise the indicators to their benefit. It's about having an open mind and realizing that everyone is different as well as there is no 'one size fit all' trading style.
Ignored
Yes, you are absolutely right.
I never said that people trading indicators are wrong.

I only said, that when you really understand Price Action and the Consolidation, you do not need indicators.

Look, follow the logic:

You trust what the Indicator shows, you need confirmation from the Indicator.
Thus, You do not trust Yourself, You do not trust Price Action, You trust the Indicator.

In order to trust the Indicator and be succesfull, you must know something about Price Action.
You must see what is happening on the chart. Otherwise You would not be able to trust the Indicator.

The Indicator rule is: If You see an indication and it confirms what You see on the chart, then it is proper.
If, additionally, it is also confirmed by another indicator, then the probability of success is even higher.

If You already see it on the chart, then the problem is You, a psychological problem.
If You already see it on the chart, all other confirmation is needless.
If You trust Yourself, if You trust what You see, if You understand.

Somebody said, earlier, that "we all know what consolidation is, we all know that price
breaks out or down". Many know, not many understand.

I will give You an example:
Many people have bad habits, ie. they smoke cigarretes.
They know smoking is killing them. Yes, they do know!
Believe me, the moment they understood, they would have quit, completely and ultimately.

How do I know? I had that realization in my life, I quit immediatelly.
Never stared over again, because I understand.

Understanding is not about writing a mathematical equation!
Understanding is not about dictionary definition!

It is the deep inner realization of the fact, itself!
It is an Enlightment! It is knowledge at the core of your existance.

When You understand, that is when confirmation is not necessary.
That is when You are the confirmation.

This is not easy, fact, but people have done it!

BTW.
It, truely amazes me that the English native speakers are those who fight the most
in the issue of protocol and proper meaning of labels, names.
Out of all the nations of this World, they should be one of the last!
Just open any English Dictionary - see how many meanigs can one of their words have.
When communicating in the English language, it is the context of the whole sentence
which decides the meaning of the specific word.
The stand-alone words says nothing, or a lot of different things at once.

I know this, because I have, once read the whole Great English - Polish, Polish-English
Dictionary in two volumes. I had a contract with a publisher to create an English - Polish
Dictionary of Synonyms and Anthonyms, took me over 12 months of hard work, luckily
I found a clever way to organise my work with the aid of the computer.
Unfortunatelly, never got published.
Trade the facts, not opinions.
 
 
  • Post #137
  • Quote
  • Mar 22, 2013 2:52pm Mar 22, 2013 2:52pm
  •  jgadefelth
  • | Joined Jan 2008 | Status: Trillion Dollar Man | 1,494 Posts
what shall i do to understand it all ?


best regards
 
 
  • Post #138
  • Quote
  • Edited 3:58pm Mar 22, 2013 3:04pm | Edited 3:58pm
  •  Dadas
  • | Commercial Member | Joined Sep 2012 | 3,282 Posts
Quoting Gumrai
Disliked
If I were to post a chart consisting of red and green candles and then referred to the blue candle, you may probably think "What is the idiot talking about?!" And rightly so.
Ignored
Well, what if one was color blind?
Then, I do know there is no protocol for Candle colors.
They can be any color the trader chooses.

That is why I stick to my default template with my colors.
My Candles are OrangeRed for Bearish, Aquamarine for Bullish.

And, no, I would not think that.
I would try to figure out what the person meant, assuming he/she is not an idiot.

I would ask, if I were not able to figure this out for myself.

Gumrai, if Your basic assumption of other people is what You quote,
I wish You all the best, but this will not get You far!

Thank You for being here, Gumrai!
Trade the facts, not opinions.
 
 
  • Post #139
  • Quote
  • Mar 22, 2013 3:11pm Mar 22, 2013 3:11pm
  •  Dadas
  • | Commercial Member | Joined Sep 2012 | 3,282 Posts
Quoting jgadefelth
Disliked
what shall i do to understand it all ?
Ignored
Maybe, start over, step-by-step?

You know, it took me quite a while to see this.

Take a chart, any chart in the weekend.
Rewind back into history.
Look for PTECZ and highlight them.
Look for those more important ones, the PTECZ after long trend candles.
Look how price acted in the PTECZ and what happend later.

During the Open Market, first, do not trade, not even demo.
Just watch for PTECZ and highlight them.
Take the horizontal line and place it where you would open a trade.
See what happens.

Repeat this excercise for a week or two.
Then, start with demo virtual money.
Practise for at least 2-3 months, or until you Profit regularly over Loss.

When you decide to go live - real, just do the same.
Trade the facts, not opinions.
 
 
  • Post #140
  • Quote
  • Edited 3:56pm Mar 22, 2013 3:40pm | Edited 3:56pm
  •  Dadas
  • | Commercial Member | Joined Sep 2012 | 3,282 Posts
Look at this:
I drew these PTECZ yesterday or the day before.
http://charts.mql5.com/1/195/audusd-h4-fxsalt-ltd-2.png

Either trust what you see, or do not.

The choice is Yours.

http://charts.mql5.com/1/195/audusd-m30-fxsalt-ltd.png


http://charts.mql5.com/1/195/audusd-...salt-ltd-2.png

http://charts.mql5.com/1/196/audusd-m5-fxsalt-ltd.png
Trade the facts, not opinions.
 
 
  • Commercial Content
  • /
  • Price Action in Day Trading by Dadas
  • Reply to Thread
    • 1 56Page 789 235
    • 1 Page 7 235
0 traders viewing now
  • More
Top of Page
  • Facebook
  • Twitter
About FF
  • Mission
  • Products
  • User Guide
  • Media Kit
  • Blog
  • Contact
FF Products
  • Forums
  • Trades
  • Calendar
  • News
  • Market
  • Brokers
  • Trade Explorer
FF Website
  • Homepage
  • Search
  • Members
  • Report a Bug
Follow FF
  • Facebook
  • Twitter

FF Sister Sites:

  • Metals Mine
  • Energy EXCH
  • Crypto Craft

Forex Factory® is a brand of Fair Economy, Inc.

Terms of Service / ©2023