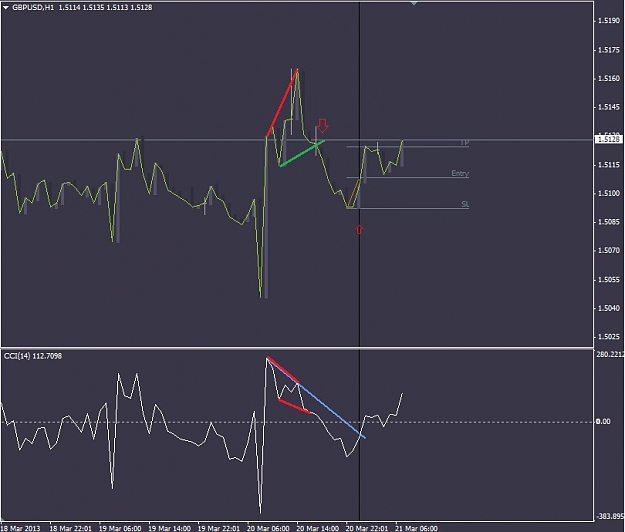
Am I looking that this chart correctly? We have a down trend overall and I am looking for bearish divergence so I will be trading with the trend. Is this a better tactic rather than just to trade any divergence? In this case we see regular bearish divergence on both 50 and 14 CCI. Have I pulled then fib correctly and have I marked the entry point correctly?
Ignored
Morning =)
I have just got back infront of a PC! So as I see there is plenty to answer.
So, On your screen shot. There is much more to see and not just that Divergence. I don't want to draw all right now on it. But for sure I can see many smaller but very good signals. Please try to break it down into a closure view and markl the divers.
I'll try to put some more examples to make it easier to see them for everyone.
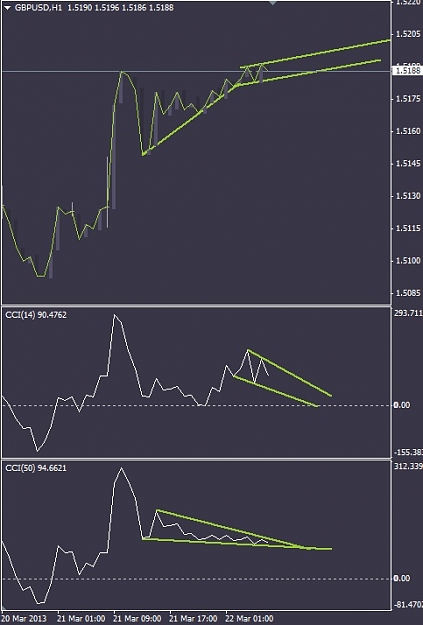
In Post 17 you show a 1hr GU chart, what I don't see is any divergence on the chart. Can you please explain that chart.
Thanks
Ignored
Sorry, My bad on that post that I forgot to draw it on the chart. Let me correct it for you. The Red one is the Divergence that refers to the blue TL. The green on is another good signal that I could not see my self as well =)
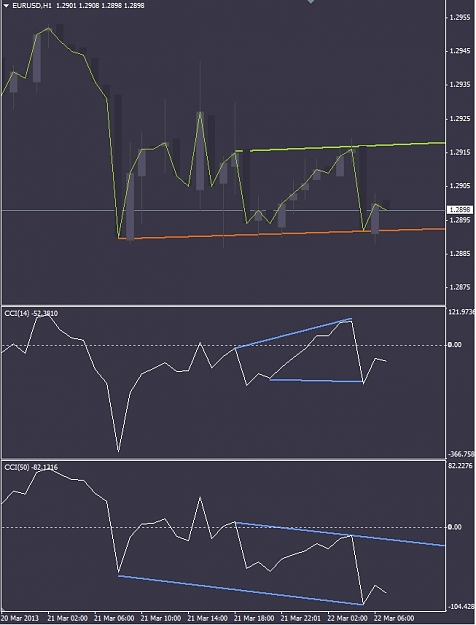
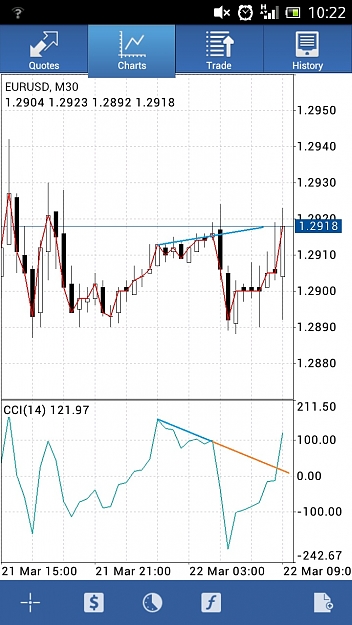
EU H1 -- The CCI 50 and 14 are showing a bullish divergence (I think, if I read correctly). I am demoing it. Any thoughts? Attachment
Ignored
Hi!
On the 14th period of CCi I can't confirm the Divergence, but on the 50th period it is. Actualy those two bottoms are pretty far away from eachother. As that is a bullish diver, we can expect some up move now.
Hi, Tools,
congratulations, very thoughtful insight!
I have few suggestions, though, do you know that RSI was actually created not for oversold/overbought conditions as many traders think,
but actually to measure divergence with the price? It is built that way that it shows a longer trend over a period of bars, and when the
speed of the price slows down, the indicator starts to show divergence with the price even as it goes with the trend. Not many understood
at what moment the price is only slowing and when the price is changing the direction. You got it right.
The other suggestion is - there is an indicator somewhere in FF called TDI - Trader's Dynamic Index, it is based on RSI, but somehow improved.
I checked it against CCI - using the default settings. It shows the divergencies much better than CCI, the trendline that has to be broken
before entering the trend is much more accurate with TDI, (CCI not always has it), so my suggestion is check this indi during weekend.
Otherwise, wonderful, insightful, useful trend.
I know the TDI, I used it recently but not with this technique. Once I get home and kick the sh*t out of if I will check it. I realy liked it once I used it for some price action experiments.
I'll have a look on the RSI as well then. I'll have a lot time for it this weekend =)
Hi, Tools,
congratulations, very thoughtful insight!
I have few suggestions, though, do you know that RSI was actually created not for oversold/overbought conditions as many traders think,
but actually to measure divergence with the price? It is built that way that it shows a longer trend over a period of bars, and when the
speed of the price slows down, the indicator starts to show divergence with the price even as it goes with the trend. Not many understood
at what moment the price is only slowing and when the price is changing the direction....