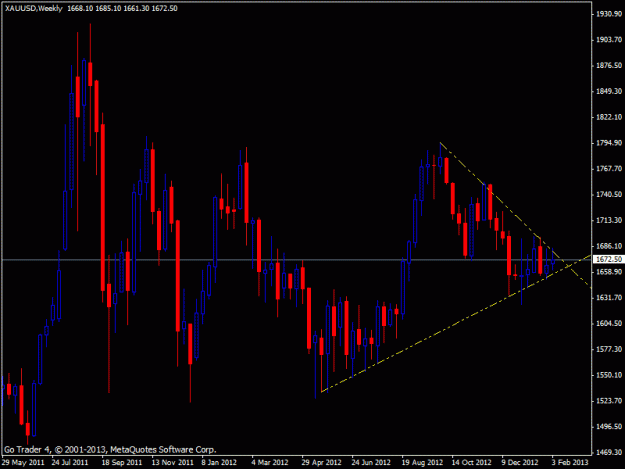
Hi, anyone looking at GOLD? Seems P is in a tight triangle in W. If P close below or above the triangle, then its a good trade to go into. Hope I got this right.
Hi, anyone looking at GOLD? Seems P is in a tight triangle in W. If P close below or above the triangle, then its a good trade to go into. Hope I got this right.
Ignored
Yes sodiska, but I won´t trade it as long as 1,710.00 resistance area ( better even 1,800.00 ) or 1,605.00 support has been broken, it is currently quite choppy. I am more bullish for Natural Gas and Soybeans. In the metals, look at Copper, that is not so heavily looked upon ( some say " manipulated "....).
Joined Oct 2008
|
Status: Just be the witness.
|1,089 Posts
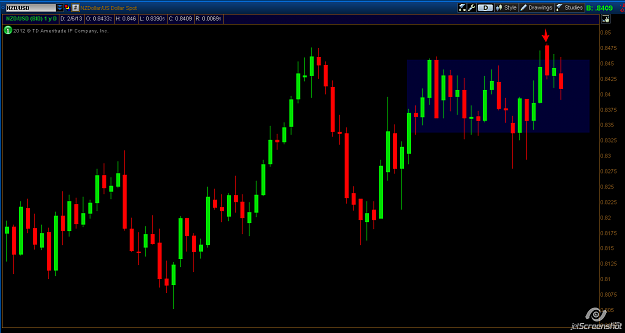
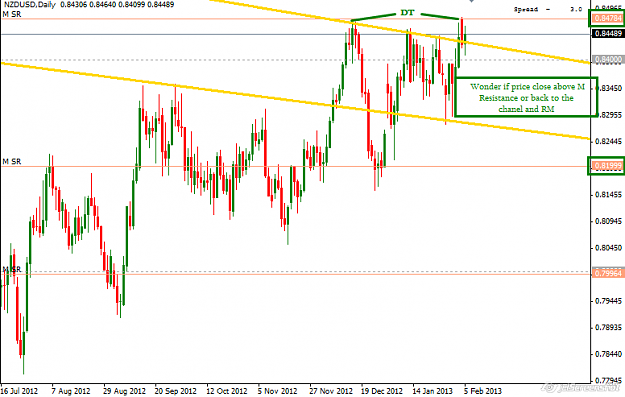
NZDUSD Daily. here we have a close-up after my W chart. This open range of the bearish candle might be a bit strange at first sight, but you sometimes have these, look at other examples, like on Yahoo after earnings, or in Stocks for example Deutsche Bank.
Yes sodiska, but I won´t trade it as long as 1,710.00 resistance area ( better even 1,800.00 ) or 1,605.00 support has been broken, it is currently quite choppy. I am more bullish for Natural Gas and Soybeans. In the metals, look at Copper, that is not so heavily looked upon ( some say " manipulated "....).
Hi, anyone looking at GOLD? Seems P is in a tight triangle in W. If P close below or above the triangle, then its a good trade to go into. Hope I got this right.
If it closes bellow the triangle then 1566 becomes the Tg with MM@ 1628 !..notice how the P is stuck within the doji's range and this make the 1628 to be the first MM level !
If it closes bellow the triangle then 1566 becomes the Tg with MM@ 1628 !..notice how the P is stuck within the doji's range and this make the 1628 to be the first MM level !
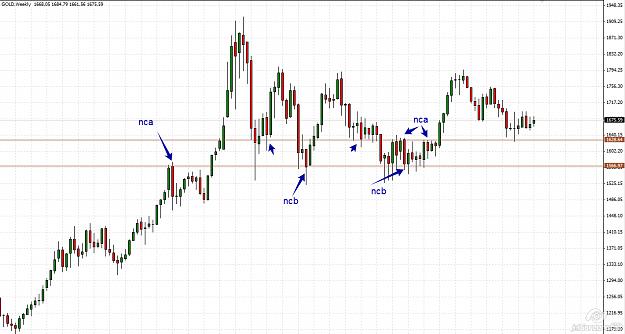
Hi, how do you define NCA and NCB (criteria for NCA and NCB)?
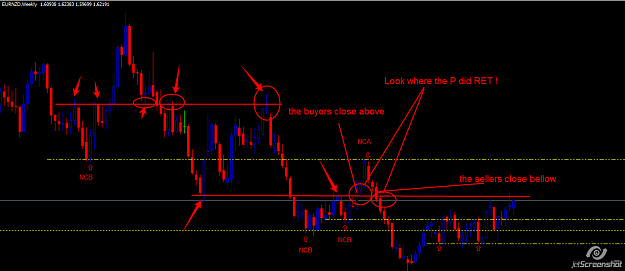
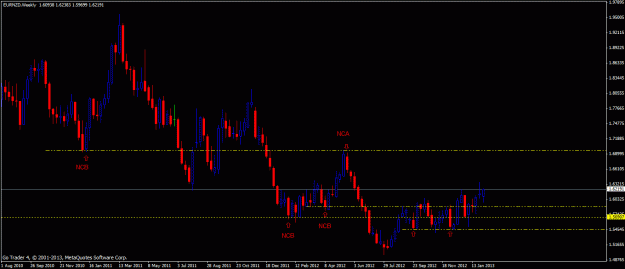
NCA& NCB stay for no close above& no close bellow and represents those levels what act as R and S...levels identified using the open/ close of the swing. .....these type of S/ R levels are one of the most powerful levels in trading giving very important information as long as the candle/ swing doesn't close above/ bellow !
P.S. Let me know if it is all clear...put some chart with these kind of levels and we will talk about it !
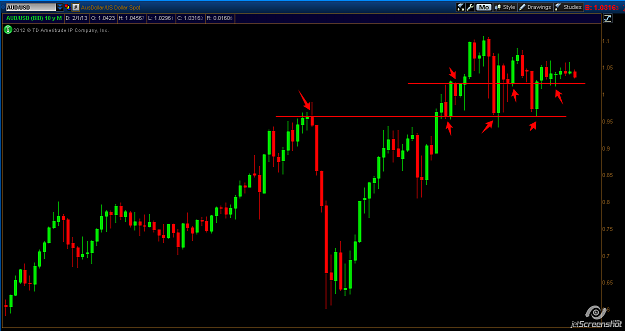
Look at AUDUSD !
NCA& NCB stay for no close above& no close bellow and represents those levels what act as R and S...levels identified using the open/ close of the swing. .....these type of S/ R levels are one of the most powerful levels in trading giving very important information as long as the candle/ swing doesn't close above/ bellow !
P.S. Let me know if it is all clear...put some chart with these kind of levels and we will talk about it !
Look at AUDUSD !
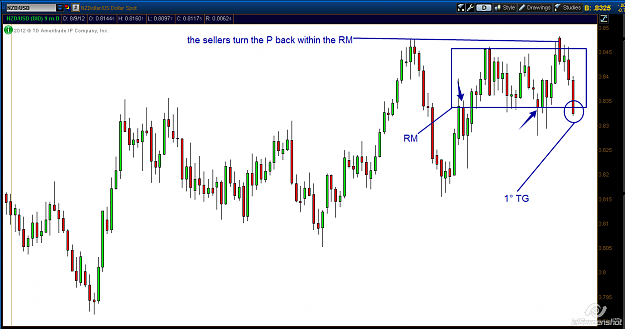
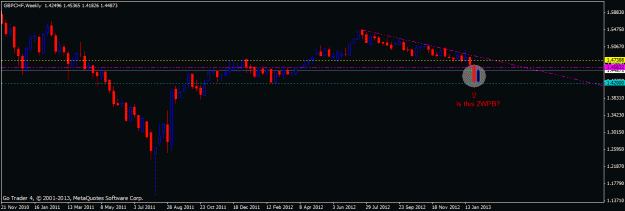
I have further question, attached is the GBPCHF chart. I circle 2WPB, is that correct?
In order to have a 2TFPB the candle must have almost the same dimensions, as for a bullish one we always prefer to see the 2° candle close higher than the 1° candle open.....and....GBPCHF is a really mess right now...don't complicate with it....there are far more interesting pairs !
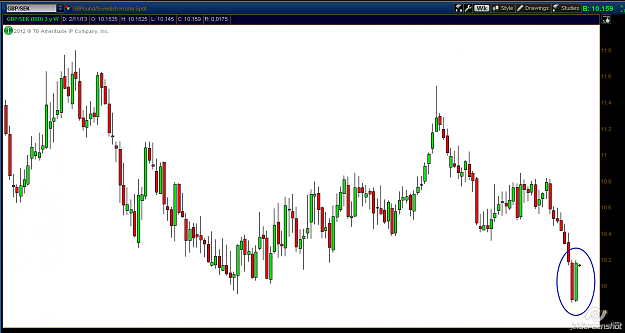
If you want to see a real 2WPB, take a look at GBPSEK !
In order to have a 2TFPB the candle must have almost the same dimensions, as for a bullish one we always prefer to see the 2° candle close higher than the 1° candle open.....and....GBPCHF is a really mess right now...don't complicate with it....there are far more interesting pairs !
If you want to see a real 2WPB, take a look at GBPSEK !