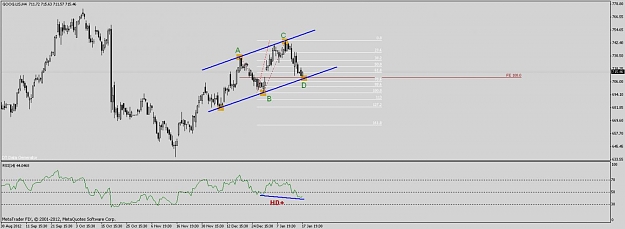
According to the structure of the chart in H4 time frame we are observing a BAT pattern. Based on lack of association in MACD indicator with the price there is a downward divergence likelihood. The timing will be fulfilled and we are expecting a drop if negative divergence approved.
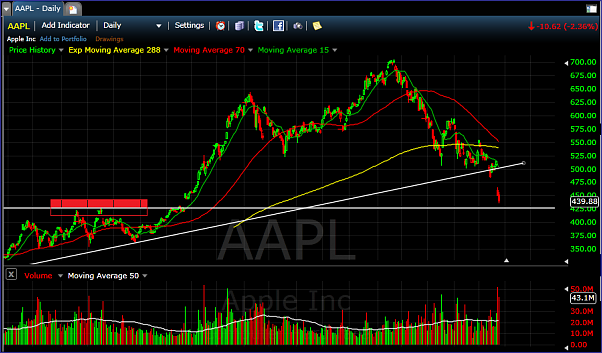
Could look good in Demand zone at about four and a quarter.
Ignored
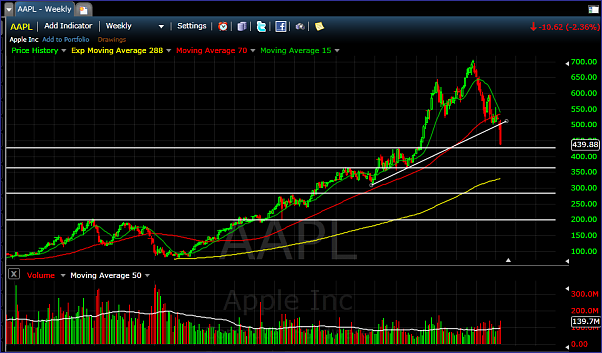
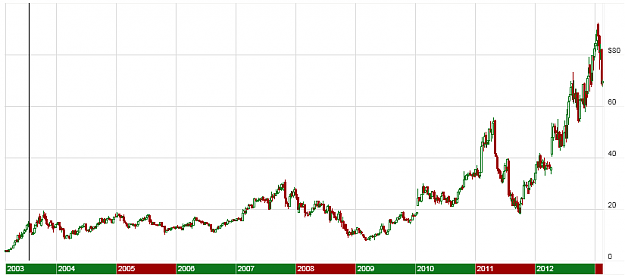
The gap up was from $420 in early 2012 was due to an earnings report, right? It'll bounce off that, for sure. However, I think it can go lower. $325, $250, and $200 are long term targets for me. Even as low as $100! But maybe that's just crazy.
The gap up was from $420 in early 2012 was due to an earnings report, right? It'll bounce off that, for sure. However, I think it can go lower. $325, $250, and $200 are long term targets for me. Even as low as $100! But maybe that's just crazy.
Ignored
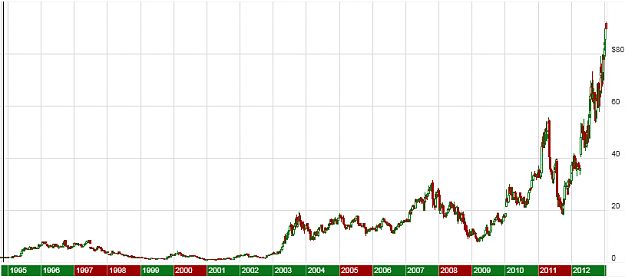
I dunno man, I see where ya get the 300s n such and running down to a deuce seems a little bit of a stretch, but very possible. I'd actually put more faith in AAPL than Gold, and I really can only conceptualize fourteen and change on XAUUSD.
Anything is possible and really, that's what makes the game great.
Personally, I won't be trading this, but if the bitch hits a hunny, I will be selling the farm to load the boat!!
Attached Image (click to enlarge)
Money Can't Buy Happiness. Poverty Can't Buy SHIT! You Choose!
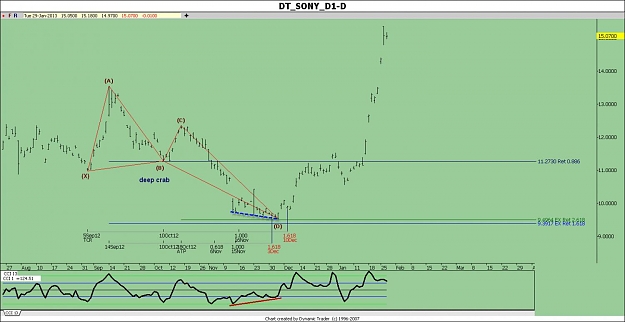
In Daily time frame we can see DEEP CRAB pattern. according to time fulfillment and rebound from prz zone we will be a wittness of the price growth if everything goes in favor of our outlook.
Here are some quick updates on stocks for 15/16 February for the US Stock market..
–> To get products into more hands, Google will open its own stores by the end of the year | 9to5Google - To get products into more hands, Google will open its own stores by the end of the year | 9to5Google
–> PDUFA Dates: How To Find 1 Day Gains (or losses) Of Up To 74% – Seeking Alpha - PDUFA Dates: How To Find 1 Day Gains Of Up To 74% – Seeking Alpha $APPA.OB $DEPO $DVAX $IMGN
–> $CTL Shares Tumble After Carrier Cuts Dividend by 26% CenturyLink Shares Tumble After Carrier Cuts Dividend by 26% – Bloomberg via @BloombergNews
–> $FCEL clears Nasdaq delisting cloud.0 Back over $1.00 | HartfordBusiness.com | Hartford Business Journal Online | Business News | Greater Hartford - FuelCell Energy clears Nasdaq delisting cloud | HartfordBusiness.com
–> Delisting of Securities of $LNET, $MYRX, $GSAT., and $SCHS from The NASDAQ Stock Market - Delisting of Securities of LodgeNet Interactive Corporation, Myrexis, Inc., Globalstar, Inc., and School Specialty, Inc. From The NASDAQ Stock Market
–> $NOK Nokia to look to the sky and bring solar charging to Windows Phones Nokia to look to the sky and bring solar charging to Windows Phones? | Windows Phone Central