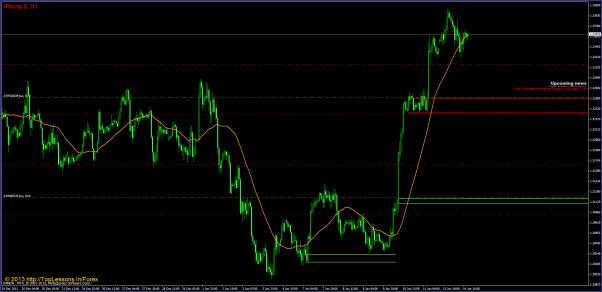
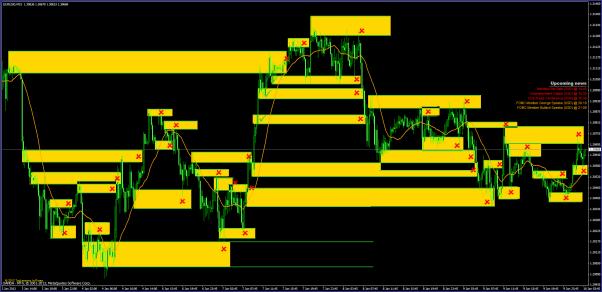
Attached Image (click to enlarge)
This thread is going to be about my understanding of how the markets work. It will be a discussion of principles that work on all markets and all timeframes, based on the application of ideas found in physics and buddhist philosophy. I know that might seem strange at first, but the same principles that apply to our inner and outer reality are the same ones that drive the markets. You don't have to believe anything I say here. Just filter everything through your own reason and come up with the conclusions. Also, I will never hold that the way I trade is the only way to trade successfuly. There are countless ways of making profits and countless ways of losing money. You just have to pick the ones that fit your personality and taste
I am hoping there will be a little interaction here. Initially, I wanted to open this thread in the non-commercial area, but, apparently, I'm not allowed to, because I'm a commercial member. Everything in this thread is free stuff, I am not advertising anything. Feel free to ask questions any time during the discussion. After we finish describing the model and I start posting some live trade examples, I am expecting at least a couple of traders posting their charts here. So, let's cut to the chase!