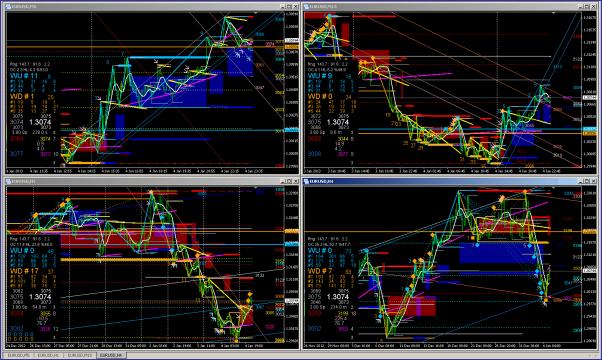
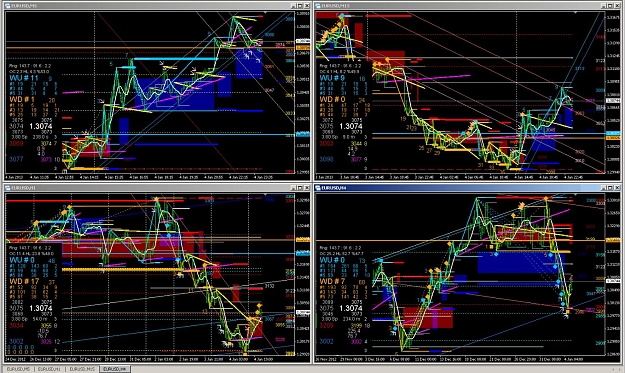
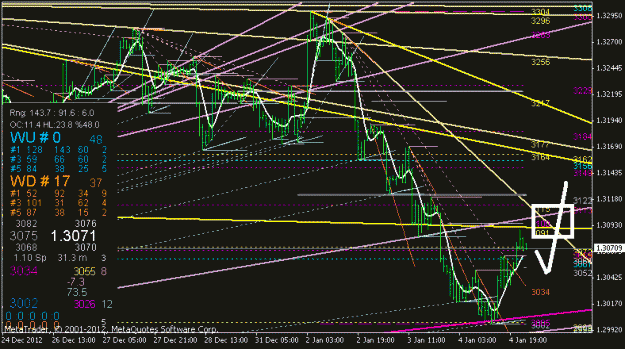
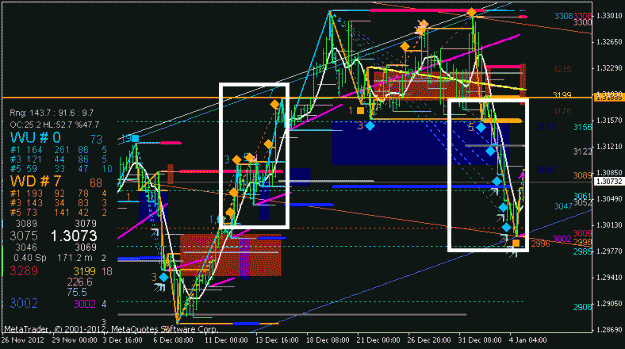
4H CT
see the diamonds in Rectangles
same level for both direction
this means 4H CT is in a loop / back & forth zone
it is wavig both directions & going nowhere
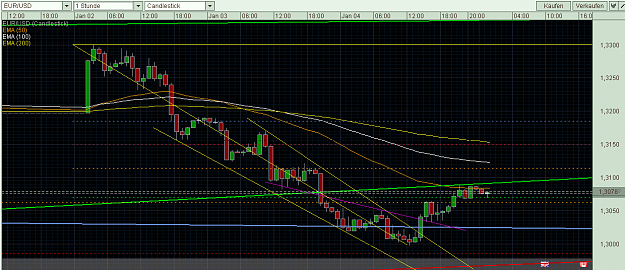
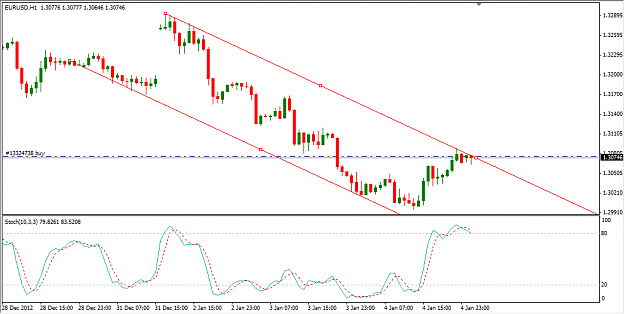
EUR/USD retreated in the first week of 2013, after another attempt to break higher evolved into a downfall. The fiscal cliff deal boost proved temporary after the Fed showed less dovishness. The focus shifts to Europe, with an all-important rate decision as well as employment data. Here is an outlook on the main market-movers this week and an updated technical analysis for EUR/USD, now at lower ground. US politicians managed to avert the fiscal cliff, but set the ground for another crisis in two months time: the initial market cheer was also hit by Fed’s meeting minutes: is the central bank willing to ease the easing at the end of the year? Not that fast, but the euro was already hit. In the euro-zone, Spanish and German employment figures improved considerably. On the other hand, the Eurozone economies are still in a downward trend mainly Greece Spain, Italy and France struggling with high debt and low growth. How does Mario Draghi see the situation? We will know this week. EUR/USD daily graph with support and resistance lines on it. http://www.forexcrunch.com/wp-conten...13-400x213.png
Sentix Investor Confidence:Monday, 9:30. Sentix investors’ survey showed an improvement in in investors’ confidence in December amid the European Central Bank commitment to safeguard the euro. Investor Confidence reached -16.8, following -18.8 in November but lower than the -16.2 reading predicted by analysts. A further improvement to -13.7 is expected now.
PPI : Monday, 10:00. Euro zone factory prices climbed a moderate 0.1% in October, in line with the slowing pace in consumer inflation, although higher than the flat reading forecasted by analysts. On a yearly base, producer price index was up 2.6% in October compared to the same month a year ago. A drop of 0.1% is forecasted now.
German Trade Balance: Tuesday, 7:00. Germany’s trade surplus contracted in October to 15.2 billion euros from 16.9 billion in September, the lowest reading since March and also below the 15.9 billion forecasted. The reading indicates a contraction in the fourth quarter. Surplus is expected to narrow to 15.9 billion.
French Trade Balance: Tuesday, 7:45. France’s trade deficit contracted for a second month in October, to 4.7 billion euros from 5.0 billion euros in September, amid a modest rise in exports. Meantime imports dropped to 42.467 billion euros from 42.535 billion the previous month. Deficit is expected to reach 4.87 billion.
Retail Sales; Tuesday, 10:00.Retail sales across the European Union dropped considerably more than forecasted in October, down by 1.2% while anticipated a small drop of 0.2%, following a 0.6% fall in the previous month. The main cause for this slump is the sharp decline in Germany. This is further evidence to the gloomy situation in EU’s households. A rise of 0.5% is expected now.
Unemployment Rate: Tuesday, 10:00. The eurozone’s unemployment rate reached a new record high in October climbing to 11.7% from 11.6 % in September and 10.4% a year ago. A further increase to 11.8% is expected this time.
German Factory Orders: Tuesday, 11:00. Demand for German products rebounded unexpectedly in October with a 3.9% rise after a revised drop of 2.4% in September. Foreign demand was the driving force behind this jump, rising 6.7%. On an annual basis, orders were still behind last year’s levels, shrinking 2.4% in October compared to the same month a year ago. A drop of 1.4% is forecasted now.
German Industrial Production: Wednesday, 11;00. German output plunged in October by 2.6% following a 1.3% decline in September indicating EU recession may be catching up with Germany. The main drop occurred in durable and capital goods production. The fourth quarter is expected to register contraction despite the holiday season shopping. An increase of 1.1% is expected now.
French Industrial Production: Thursday, 7:45. French manufacturing declined by 0.7% in October, following a 2.7% slump in the previous month. The main decline occurred in transport equipment activity. The French Government is planning to grant a billion-euro tax break to compensate for spending cuts and higher consumer taxes. A rise of 0.2% is predicted.
French CPI: Thursday, 7:45. Consumer Price index (CPI) declined by 0.2%, following a climb of 0.2% in October. On a yearly base, CPI rose by 1.4%. The main cause for this decline was lower prices for energy product. An increase of 0.4% is forecasted this time.
Rate decision: Thursday, 12:45. press conference at 13:30. There is more than a 50/50 chance that the ECB will cut the main interest rate from 0.75% to 0.50%, but this isn’t priced in. With PMIs pointing to more weakness in manufacturing and with a weak holiday season, the ground is ready for the ECB to act. In addition, inflation is almost at the 2% target, and is forecast to slide. Mario Draghi will probably refrain from pushing the deposit rate into negative territory and leave this policy option to a future deterioration. It’s important to note that bond yields of Spain and Italy are significantly lower now. The negative rate ammunition could be kept dry for another round of the crisis. If the ECB does announce a negative deposit rate, this would be another step in the “currency wars” and the euro could tumble down.
French Gov Budget Balance: Friday, 7:45. The French government budget deficit increased in October to €94.6 billion, up from a deficit of €85 billion in the previous month. However on a yearly basis, deficit contracted by €4.8 billion from €99.4 billion recorded in October of the previous year.
*All times are GMT. EUR/USD Technical Analysis €/$ began the week with another attempt to tackle the 1.3290 line (discussed last week). After this attempt failed, it was all downhill from there, and the pair found support only at the very round 1.30 line. It finally closed at 1.3068. Technical lines from top to bottom: In the distance, 1.3480 was the peak seen in February and provides a significant backstop to 1.34. 1.34 was a stubborn cap during the spring of 2012 and is the far line in the distance. The next stepping stone is at 1.3350, which worked as a pivotal line in the past. Below, 1.3290 served as resistance before the pair collapsed in May, and despite a small breakout in December, the line remains intact -Yet another, third attempt to break higher, failed and the pair eventually collapsed in January. 1.3240 was now a pivotal line in the middle of December’s high range. It separated trading zones more than once in December and also provided some support in January. 1.3170, which was the peak of September, served as support for the pair after the break in December and is a key line on the downside. 1.3130 proved to be strong resistance during December 2012 and now switches positions to support. 1.3110 is a minor line after working as temporary resistance in December 2012. 1.3030 provided some support at the same period of time, and also at the end of November 2012. Both are minor in comparison with the next line. The very round 1.30 line was a tough line of resistance for the September rally. In addition to being a round number, it also served as strong support. In January 2013 it served as the last line of support, at least for now. It is closely followed by 1.2960 which provided some support at the beginning of the year and also in September and October – the line is strengthening once again after temporarily cushioning the fall during December. 1.2880 provided some support in October and also in late November and December. It proved to be a backstop on the initial false rally after Obama’s victory. 1.28 is the bottom border of the range, and was eventually left behind. The pair fell to this low in September and later got close to it. 1.2750 capped the pair after the Greek elections and also had a similar role in the past. It is now a pivotal line in the range. 1.2690 was the new low after the November breakdown, and also provided support on a second downfall attempt in November 2012. 1.2624 was the low in January and now serves as weak support,1.2590 was a cap during August, before the pair surged. Below, the round number of 1.25 is not only of high psychological significance (USD/EUR 0.80) but also worked as support during the summer of 2012. 1.2440 is already a stronger line, that was a clear separator during August. Uptrend support lost The thick black line on the chart shows uptrend support that began in mid-November. his line was broken in the recent downfall, and this serves as a bearish sign.